Official Series Description


Lab Data Summary

Aggregate lab data for the FRONDORF soil series. This aggregation is based on all pedons with a current taxon name of FRONDORF, and applied along 1-cm thick depth slices. Solid lines are the slice-wise median, bounded on either side by the interval defined by the slice-wise 5th and 95th percentiles. The median is the value that splits the data in half. Five percent of the data are less than the 5th percentile, and five percent of the data are greater than the 95th percentile. Values along the right hand side y-axis describe the proportion of pedon data that contribute to aggregate values at this depth. For example, a value of "90%" at 25cm means that 90% of the pedons correlated to FRONDORF were used in the calculation. Source: KSSL snapshot . Methods used to assemble the KSSL snapshot used by SoilWeb / SDE

Click the image to view it full size.

Pedons used in the lab summary:

MLRALab IDPedon IDTaxonnameCINSSL / NASIS ReportsLink To SoilWeb GMap
11377IL0650021977IL065002Frondorf1Primary | Supplementary | Taxonomy | Pedon | Water Retention | Correlation | Andic Soil Properties37.9552076,-88.6458646
11390P001289IL025040Frondorf5Primary | Supplementary | Taxonomy | Pedon | Water Retention | Correlation | Andic Soil Properties38.664444,-88.359726
11390P001389IL025052Frondorf5Primary | Supplementary | Taxonomy | Pedon | Water Retention | Correlation | Andic Soil Properties38.6369934,-88.5283813
120A71KY-107-05471KY-107-054Frondorf4Primary | Supplementary | Taxonomy | Pedon | Water Retention | Correlation | Andic Soil Properties37.3703417,-87.6896306
120A73KY-047-00273KY-047-002Frondorf3Primary | Supplementary | Taxonomy | Pedon | Water Retention | Correlation | Andic Soil Properties37.0590806,-87.6315889
120A73KY-047-00473KY-047-004Frondorf3Primary | Supplementary | Taxonomy | Pedon | Water Retention | Correlation | Andic Soil Properties36.9213361,-87.5006278
120A73KY-177-00173KY177001Frondorf3Primary | Supplementary | Taxonomy | Pedon | Water Retention | Correlation | Andic Soil Properties37.1239722,-87.0416944
120A73KY-177-00273KY177002Frondorf3Primary | Supplementary | Taxonomy | Pedon | Water Retention | Correlation | Andic Soil Properties37.1890556,-87.048
120A95P018393IL151016EFrondorf5Primary | Supplementary | Taxonomy | Pedon | Water Retention | Correlation | Andic Soil Properties37.524234,-88.6683817

Water Balance

Monthly water balance estimated using a leaky-bucket style model for the FRONDORF soil series. Monthly precipitation (PPT) and potential evapotranspiration (PET) have been estimated from the 50th percentile of gridded values (PRISM 1981-2010) overlapping with the extent of SSURGO map units containing each series as a major component. Monthly PET values were estimated using the method of Thornthwaite (1948). These (and other) climatic parameters are calculated with each SSURGO refresh and provided by the fetchOSD function of the soilDB package. Representative water storage values (“AWC” in the figures) were derived from SSURGO by taking the 50th percentile of profile-total water storage (sum[awc_r * horizon thickness]) for each soil series. Note that this representation of “water storage” is based on the average ability of most plants to extract soil water between 15 bar (“permanent wilting point”) and 1/3 bar (“field capacity”) matric potential. Soil moisture state can be roughly interpreted as “dry” when storage is depleted, “moist” when storage is between 0mm and AWC, and “wet” when there is a surplus. Clearly there are a lot of assumptions baked into this kind of monthly water balance. This is still a work in progress.

Click the image to view it full size.


Click the image to view it full size.

Sibling Summary

Siblings are those soil series that occur together in map units, in this case with the FRONDORF series. Sketches are arranged according to their subgroup-level taxonomic structure. Source: SSURGO snapshot , parsed OSD records and snapshot of SC database .

Click the image to view it full size.

Select annual climate data summaries for the FRONDORF series and siblings. Series are sorted according to hierarchical clustering of median values. Source: SSURGO map unit geometry and 1981-2010, 800m PRISM data .

Click the image to view it full size.

Geomorphic description summaries for the FRONDORF series and siblings. Series are sorted according to hierarchical clustering of proportions and relative hydrologic position within an idealized landform (e.g. top to bottom). Most soil series (SSURGO components) are associated with a hillslope position and one or more landform-specific positions: hills, mountain slopes, terraces, and/or flats. Proportions can be interpreted as an aggregate representation of geomorphic membership. The values printed to the left (number of component records) and right (Shannon entropy) of stacked bars can be used to judge the reliability of trends. Small Shannon entropy values suggest relatively consistent geomorphic association, while larger values suggest lack thereof. Source: SSURGO component records .

Click the image to view it full size.

Click the image to view it full size.

Click the image to view it full size.

Click the image to view it full size.

Click the image to view it full size.

Competing Series

Soil series competing with FRONDORF share the same family level classification in Soil Taxonomy. Source: parsed OSD records and snapshot of the SC database .

Click the image to view it full size.

Select annual climate data summaries for the FRONDORF series and competing. Series are sorted according to hierarchical clustering of median values. Source: SSURGO map unit geometry and 1981-2010, 800m PRISM data .

Click the image to view it full size.

Geomorphic description summaries for the FRONDORF series and competing. Series are sorted according to hierarchical clustering of proportions and relative hydrologic position within an idealized landform (e.g. top to bottom). Proportions can be interpreted as an aggregate representation of geomorphic membership. Most soil series (SSURGO components) are associated with a hillslope position and one or more landform-specific positions: hills, mountain slopes, terraces, and/or flats. The values printed to the left (number of component records) and right (Shannon entropy) of stacked bars can be used to judge the reliability of trends. Shannon entropy values close to 0 represent soil series with relatively consistent geomorphic association, while values close to 1 suggest lack thereof. Source: SSURGO component records .

Click the image to view it full size.

Click the image to view it full size.

Click the image to view it full size.

Click the image to view it full size.

There are insufficient data to create the 3D flats position figure.

Soil series sharing subgroup-level classification with FRONDORF, arranged according to family differentiae. Hovering over a series name will print full classification and a small sketch from the OSD. Source: snapshot of SC database .

Block Diagrams

Click a link below to display the diagram. Note that these diagrams may be from multiple survey areas.

  1. IL-2011-08-04-16 | Hamilton County - 1986

    Pattern of soils and parent material in the Grantsburg-Zanesville association (Soil Survey of Hamilton County, Illinois; 1986).

  2. KY-2010-09-10-07 | Butler and Edmonson Counties -

    Relationship of soils to topography and underlying material in the Zanesville-Lawrence-Sadler association (Soil Survey of Butler and Edmonson Counties, Kentucky).

  3. KY-2012-01-27-52 | Crittenden County - September 1988

    Relationship of soils to topography and underlying material in the Zanesville-Loring-Frondorf map unit (Soil Survey of Crittenden County, Kentucky; September 1988).

  4. KY-2012-02-01-02 | Livingston County - September 1993

    Relationship of soils to topography and underlying material in the Zanesville-Loring-Frondorf general soil map unit (Soil Survey of Livingston County, Kentucky; September 1993).

  5. KY-2012-02-01-03 | Livingston County - September 1993

    Relationship of soils to topography and underlying material in the Loring-Memphis-Nicholson general soil map unit (Soil Survey of Livingston County, Kentucky; September 1993).

  6. KY-2012-02-01-56 | Todd County - September 1987

    Relationship of soils to topography and underlying material in the Caneyville-Frondorf-Wellston map unit (Soil Survey of Todd County, Kentucky; September 1987).

  7. KY-2012-02-01-57 | Todd County - September 1987

    Relationship of soils to topography and underlying material in the Frondorf-Welkert-Zanesville map unit (Soil Survey of Todd County, Kentucky; September 1987).

  8. KY-2012-02-01-58 | Todd County - September 1987

    Relationship of soils to topography and underlying material in the Sadler-Zanesville map unit (Soil Survey of Todd County, Kentucky; September 1987).

Map Units

Map units containing FRONDORF as a major component. Limited to 250 records.

Map Unit Name Symbol Map Unit Area (ac) Map Unit Key National Map Unit Symbol Soil Survey Area Publication Date Map Scale
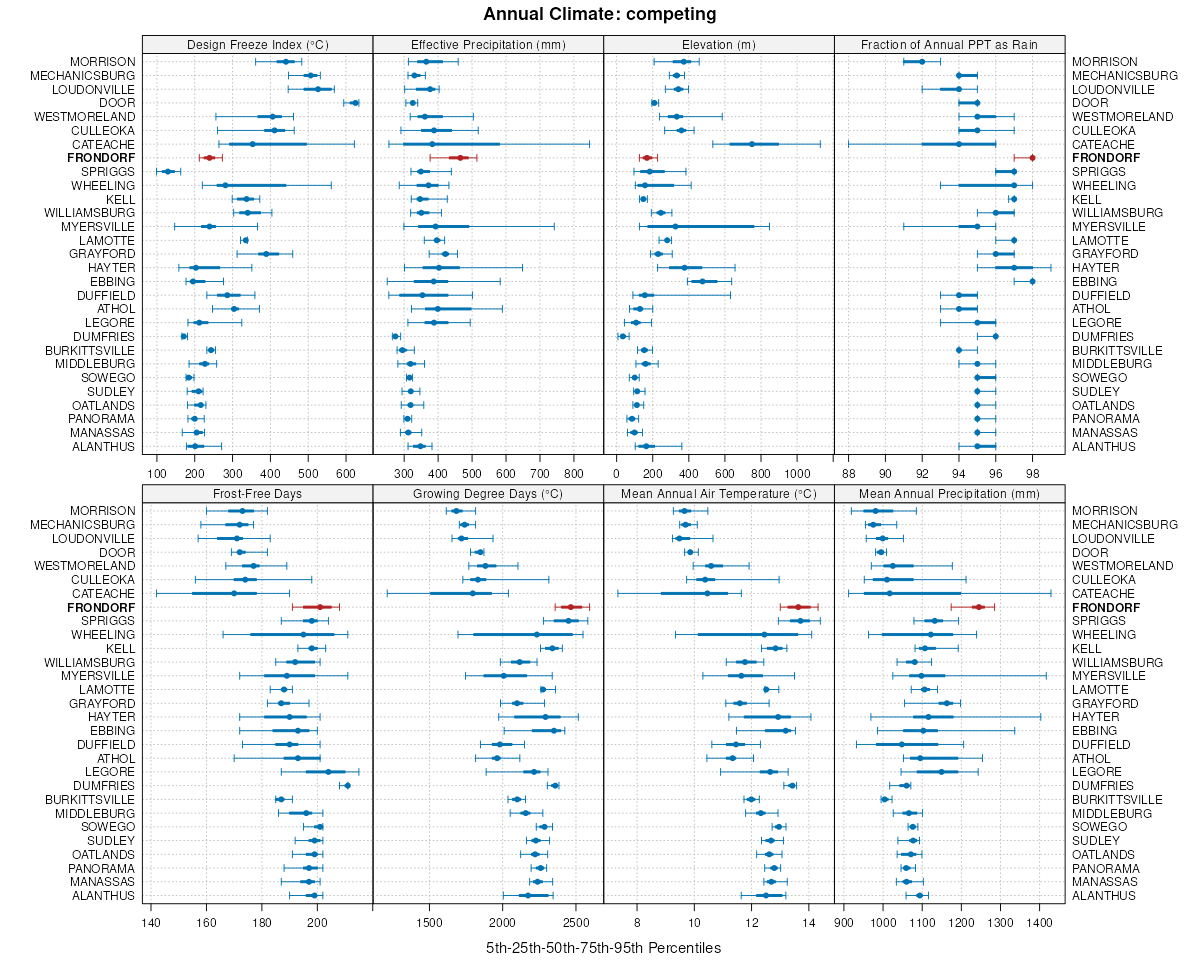
Frondorf silt loam, 18 to 35 percent slopes786F632210919228ssgil02519931:12000
Frondorf silt loam, 10 to 18 percent slopes, eroded786D2492210919128ssfil02519931:12000
Frondorf silt loam, 15 to 35 percent slopes786F29351751455w7vil06519821:15840
Frondorf silt loam, 12 to 18 percent slopes786E797178899604yil16519741:15840
Frondorf silt loam, 7 to 12 percent slopes, severely eroded786D3549178898604xil16519741:15840
Frondorf silt loam, 18 to 45 percent slopes786F290178900604zil16519741:15840
Frondorf-Weikert complex, 20 to 40 percent slopesFwF33108549057lfbjky04719771:20000
Frondorf-Weikert complex, 12 to 20 percent slopesFwD17697549056lfbhky04719771:20000
Frondorf silt loam, 6 to 12 percent slopesFnC9999549055lfbgky04719771:20000
Lenberg-Frondorf silt loams, 20 to 50 percent slopes, extremely boulderyLfE21940549119lfdjky05519851:20000
Frondorf silt loam, 12 to 20 percent slopesFrD10723549107lfd4ky05519851:20000
Frondorf silt loam, 20 to 30 percent slopesFrE5241549108lfd5ky05519851:20000
Frondorf silty clay loam, 12 to 20 percent slopes, severely erodedFsD33633549109lfd6ky05519851:20000
Gilpin silty clay loam, 12 to 20 percent slopes, severely eroded (frondorf)GpD315195549668lfz7ky08519671:20000
Gilpin silt loam, 12 to 20 percent slopes (frondorf)GlD14235549665lfz4ky08519671:20000
Gilpin silt loam, 6 to 12 percent slopes (frondorf)GlC8670549664lfz3ky08519671:20000
Gilpin silty clay loam, 6 to 12 percent slopes, severely eroded (frondorf)GpC33770549667lfz6ky08519671:20000
Gilpin silt loam, 20 to 30 percent slopes (frondorf)GlE2975549666lfz5ky08519671:20000
Gilpin silty clay loam, 20 to 30 percent slopes, severely eroded (frondorf)GpE31135549669lfz8ky08519671:20000
Frondorf-Lenberg silt loams, 12 to 30 percent slopesFdE479025492712wh58ky10719741:12000
Wellston-Frondorf silt loams, very rocky, 20 to 50 percent slopesWfE11802549358lfn7ky13919891:20000
Frondorf silt loam, 20 to 30 percent slopesFrE6257549317lflxky13919891:20000
Frondorf silt loam, 12 to 20 percent slopesFrD4440549315lflvky13919891:20000
Frondorf silt loam, 12 to 20 percent slopes, severely erodedFrD3636549316lflwky13919891:20000
Frondorf silt loam, 6 to 12 percent slopesFrC10795548710ldzbky14119721:20000
Frondorf silt loam, 12 to 20 percent slopesFrD4311548711ldzcky14119721:20000
Frondorf-Wellston-Rosine silt loams, 20 to 30 percent slopesFsE45745551254lhmdky18319831:20000
Frondorf-Wellston-Rosine silt loams, 12 to 20 percent slopes, erodedFsD234178551253lhmcky18319831:20000
Frondorf-Wellston silt loams, 30 to 50 percent slopesFrF15403551252lhmbky18319831:20000
Frondorf-Wellston-Rosine complex, 12 to 20 percent slopes, severely erodedFwD310613551255lhmfky18319831:20000
Frondorf-Wellston-Rosine complex, 20 to 30 percent slopes, severely erodedFwE32056551256lhmgky18319831:20000
Frondorf-Weikert complex, 20 to 45 percent slopesFwF16020551160lhjcky21919841:20000
Frondorf-Weikert complex, 12 to 20 percent slopesFwD8320551159lhjbky21919841:20000
Frondorf silt loam, 6 to 12 percent slopes, erodedFnC25210551157lhj8ky21919841:20000
Dekalb-Frondorf-Rock outcrop complex, 20 to 45 percent slopesDkF4950551150lhj1ky21919841:20000
Frondorf silt loam, 6 to 12 percent slopes, severely erodedFnC31590551158lhj9ky21919841:20000
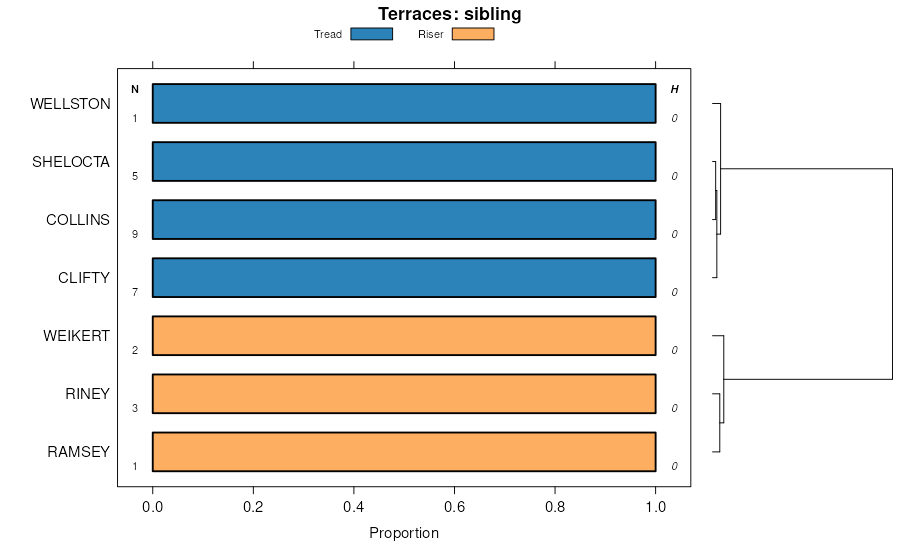
Ramsey-Frondorf complex, 20 to 60 percent slopesRaF21786557263lpw7ky22720041:12000
Frondorf silt loam, 12 to 20 percent slopesFrD8666553860llbgky22720041:12000
Frondorf silt loam, 6 to 12 percent slopesFrC7148553859llbfky22720041:12000
Frondorf-Wellston silt loams, 20 to 30 percent slopesFwE12422549381lfnzky61519711:20000
Frondorf-Wellston silt loams, 30 to 50 percent slopesFwF9630549383lfp1ky61519711:20000
Frondorf-Wellston silt loams, 12 to 20 percent slopes, severely erodedFwD37197549380lfnyky61519711:20000
Frondorf-Wellston silt loams, 20 to 30 percent slopes, severely erodedFwE35387549382lfp0ky61519711:20000
Frondorf-Wellston silt loams, 12 to 20 percent slopesFwD2638549379lfnxky61519711:20000
Frondorf-Lenberg silt loams, 6 to 12 percent slopesFrC12530551038lhdfky62119751:20000
Frondorf-Lenberg silt loams, 12 to 20 percent slopesFrD9060551039lhdgky62119751:20000
Lenberg-Frondorf complex, 20 to 30 percent slopesLfE6165551048lhdrky62119751:20000
Frondorf-Weikert-Wellston complex, 12 to 20 percent slopesFwD690549461lfrkky62919791:20000
Frondorf-Weikert-Wellston complex, 6 to 12 percent slopesFwC380549460lfrjky62919791:20000
Frondorf-Weikert-Wellston complex, 20 to 50 percent slopesFwF170549462lfrlky62919791:20000
Frondorf-Lenberg complex, 12 to 20 percent slopesFlD22265551099lhgdky63119761:20000
Frondorf-Lenberg complex, 20 to 30 percent slopesFlE18178551100lhgfky63119761:20000
Frondorf-Lenberg complex, 30 to 50 percent slopesFlF8636551101lhggky63119761:20000
Frondorf silt loam, 20 to 30 percent slopesFdE10493549504lfsyky63519781:20000
Steinsburg-Frondorf complex, 20 to 50 percent slopesSnE5687549531lfttky63519781:20000
Frondorf silt loam, 6 to 12 percent slopes, erodedFdC2130424528622nbdlky70919951:20000
Frondorf silt loam, 12 to 20 percent slopes, erodedFdD2122524528632nbdmky70919951:20000
Frondorf-Weikert complex, 20 to 50 percent slopesFwF55424528652nbdpky70919951:20000
Frondorf silty clay loam, 12 to 20 percent slopes, severely erodedFoD39424528642nbdnky70919951:20000

Map of Series Extent

Approximate geographic distribution of the FRONDORF soil series. To learn more about how this distribution was mapped, or to compare this soil series extent to others, use the Series Extent Explorer (SEE) application. Source: generalization of SSURGO geometry .