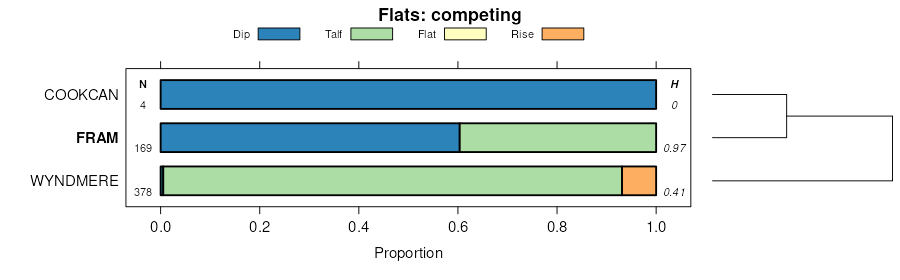
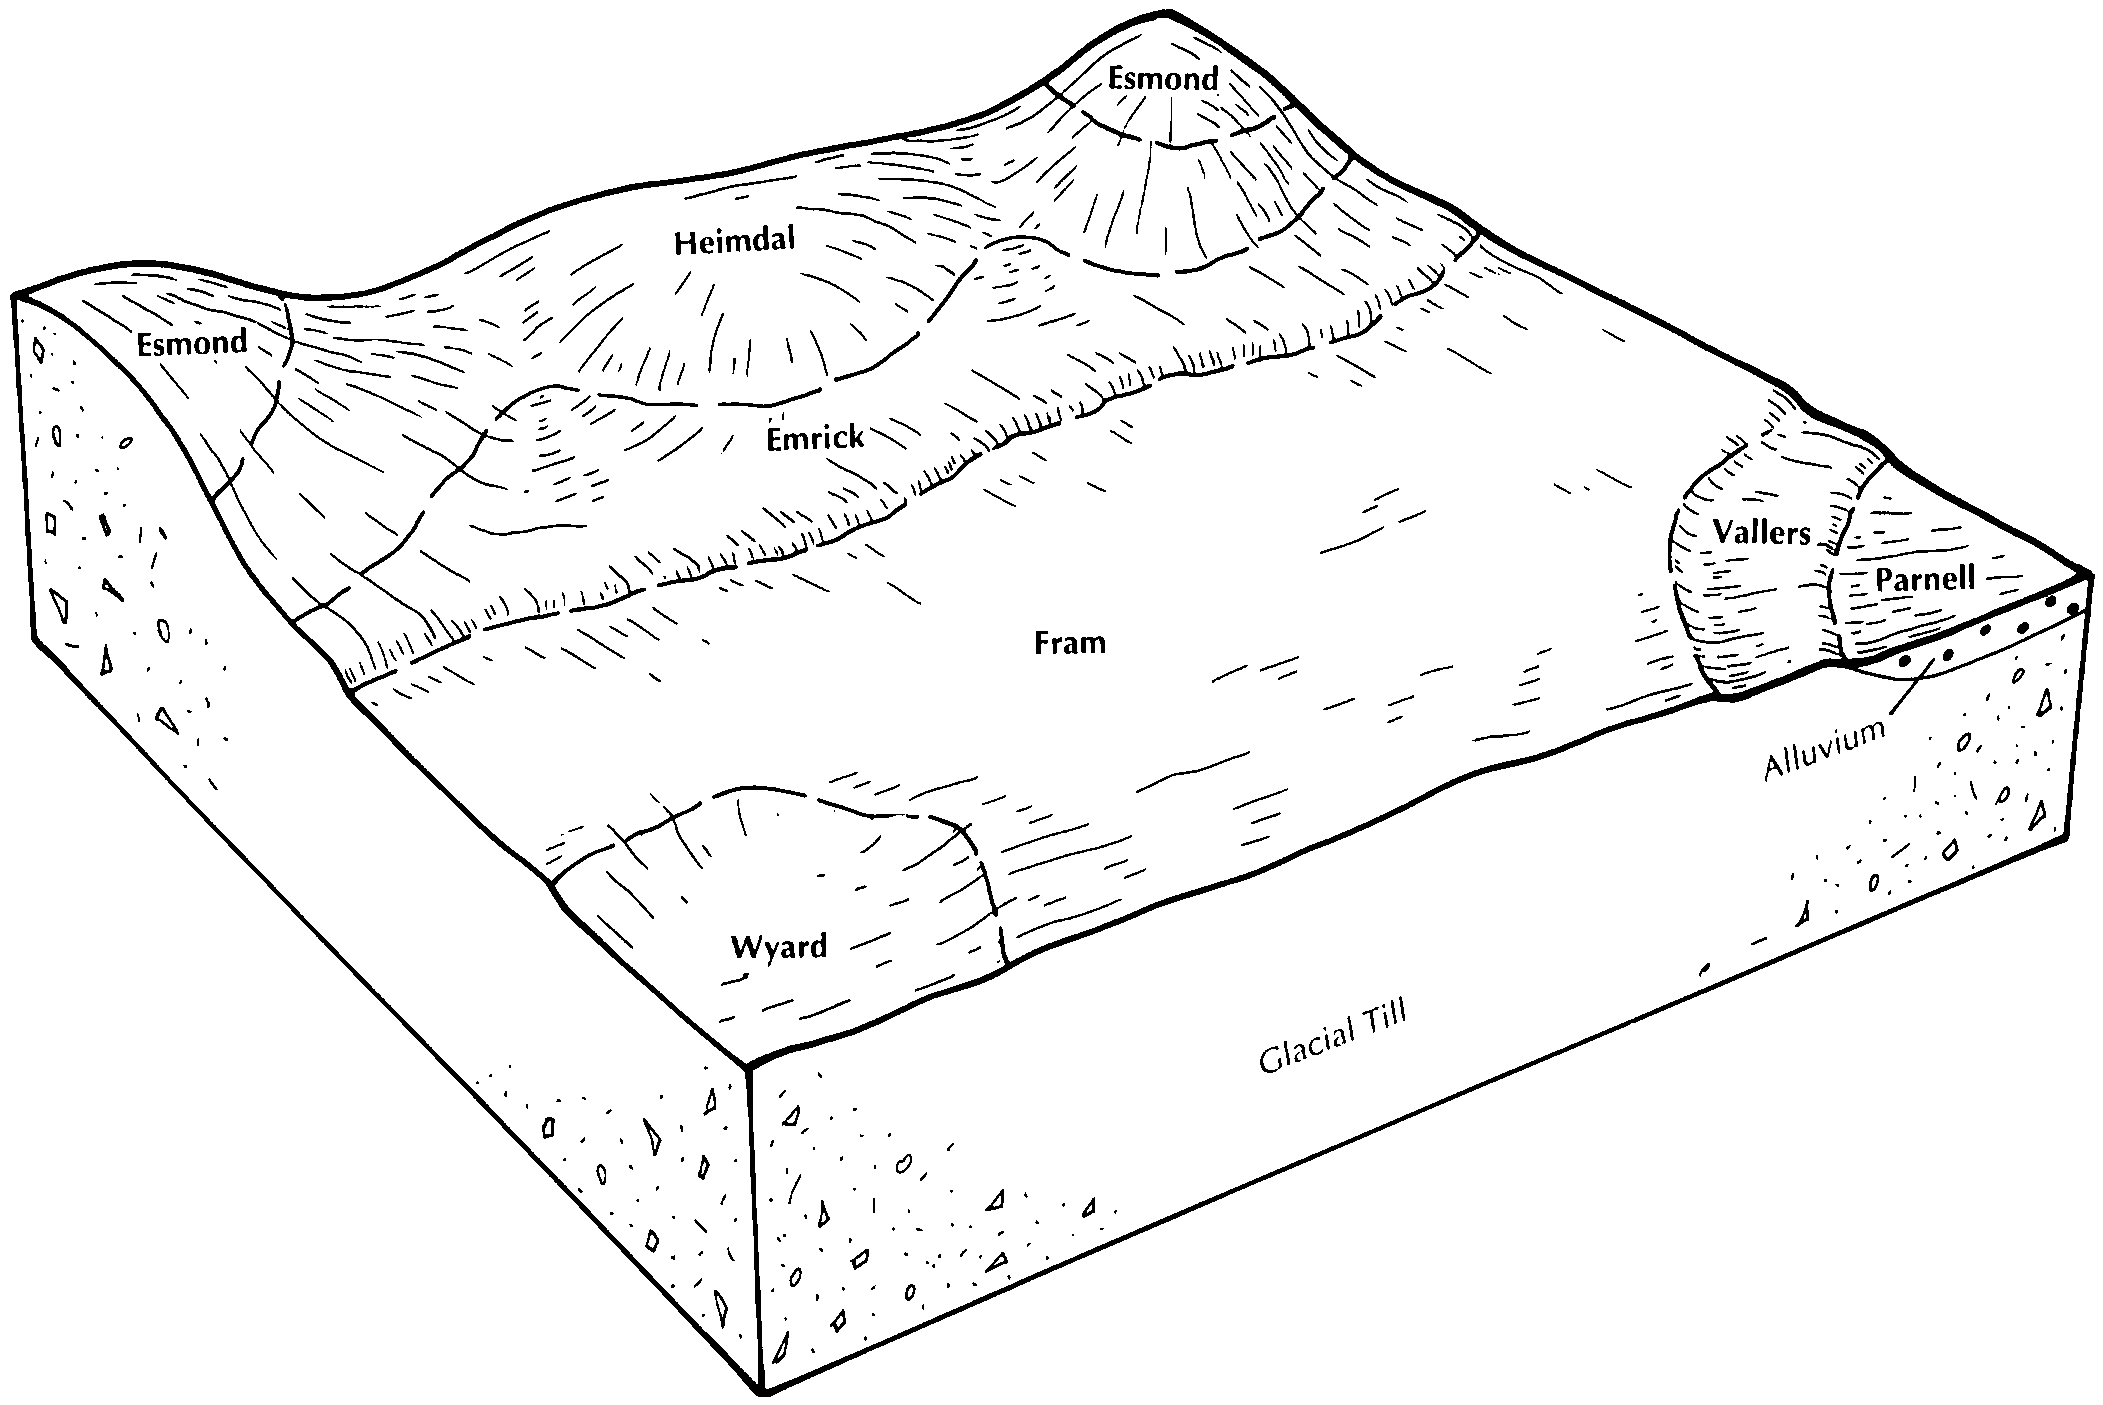
| Fram-Vallers-Parnell complex | 787 | 20016 | 396101 | f95g | mn011 | 1990 | 1:20000 |
Fram loam, 1 to 4 percent slopes | 296B | 8495 | 396080 | f94s | mn011 | 1990 | 1:20000 |
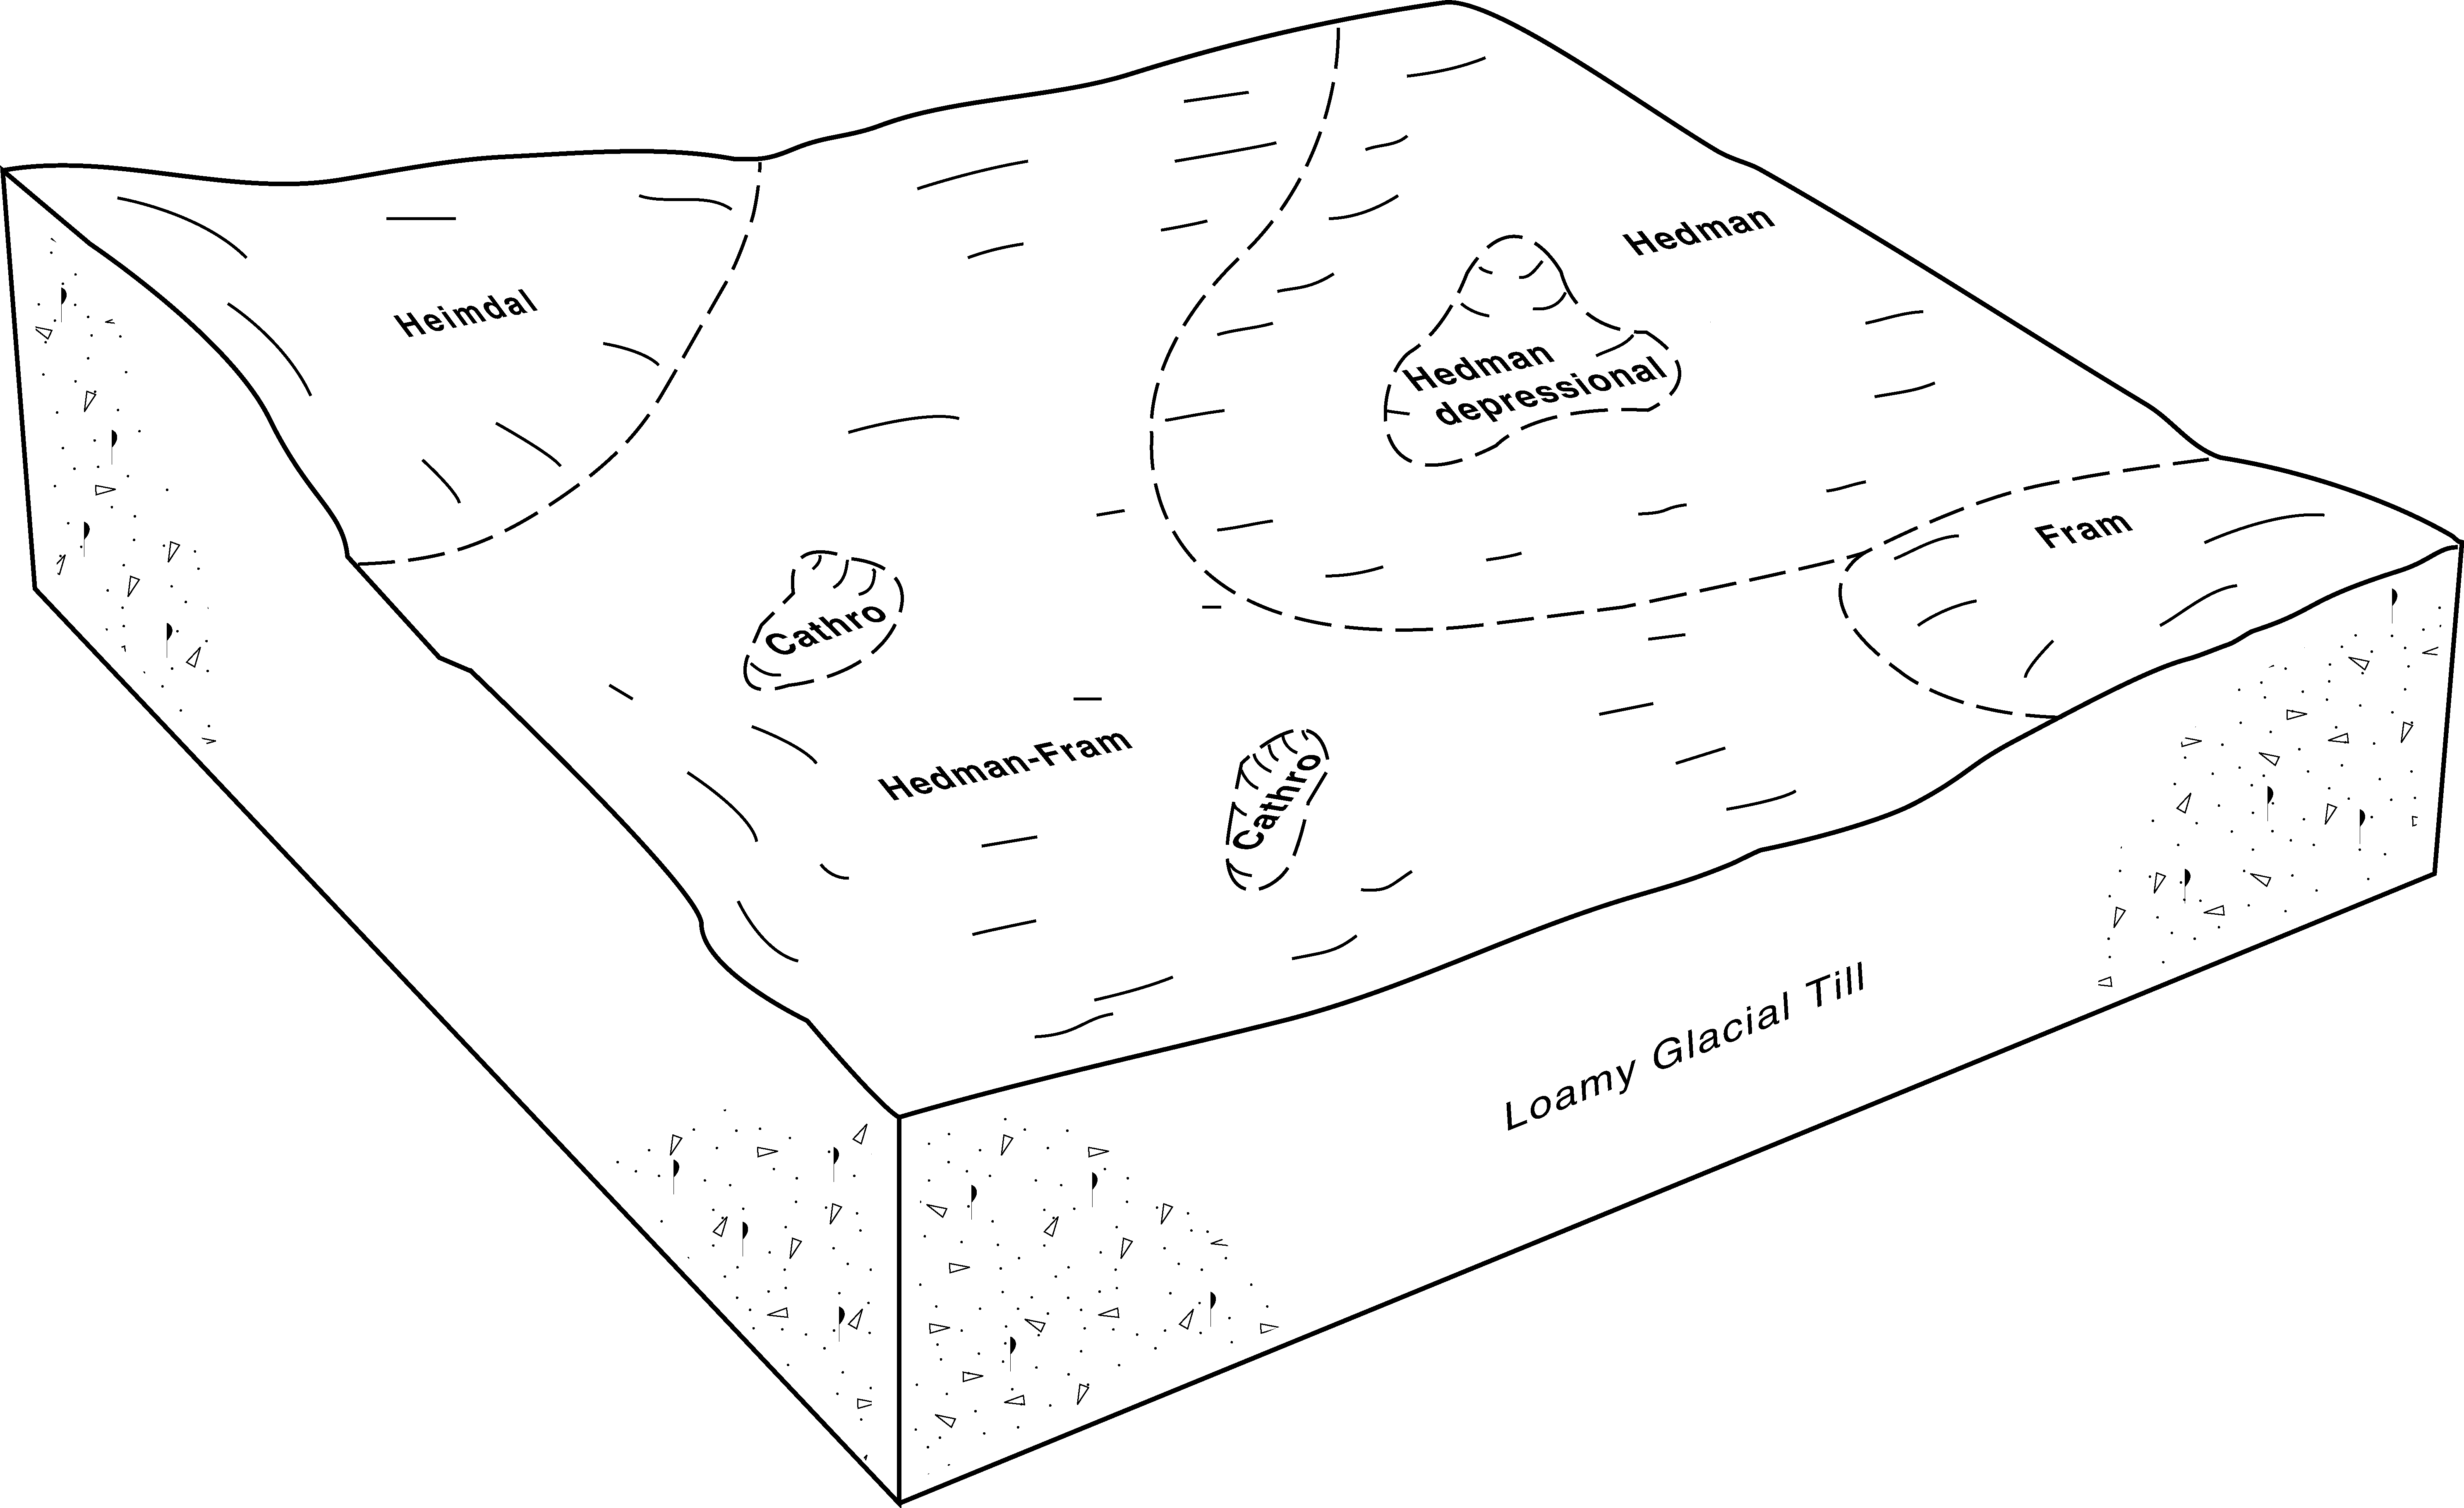
Hedman-Fram complex | 1142 | 11521 | 399197 | fddb | mn087 | 1992 | 1:20000 |
Fram loam | 296 | 2096 | 399223 | fdf5 | mn087 | 1992 | 1:20000 |
Hedman-Fram complex | 1142 | 37317 | 352171 | ctgc | mn119 | 1996 | 1:20000 |
Fram loam | 296 | 19412 | 352231 | ctj9 | mn119 | 1996 | 1:20000 |
Fram loam, 1 to 3 percent slopes | I21A | 6971 | 2799644 | prn5 | mn119 | 1996 | 1:20000 |
Hedman-Fram complex, 0 to 3 percent slopes | I31A | 4418 | 2799653 | prnj | mn119 | 1996 | 1:20000 |
Fram loam, 1 to 3 percent slopes | I21A | 173 | 2799768 | prn5 | mn125 | 2001 | 1:12000 |
Hedman-Fram complex, 0 to 3 percent slopes | I31A | 42 | 2799779 | prnj | mn125 | 2001 | 1:12000 |
Fram-Wyard loams, 0 to 3 percent slopes | F211A | 19844 | 2587651 | 2q3x9 | nd005 | | 1:12000 |
Fram-Tonka complex, 0 to 3 percent slopes | F210A | 8754 | 2587592 | 2q3x8 | nd005 | | 1:12000 |
Fram-Wyard loams, 0 to 3 percent slopes | G211A | 7921 | 2573694 | 2px05 | nd005 | | 1:12000 |
Fram loam, saline, 0 to 3 percent slopes | F216A | 4984 | 2587764 | 2q3xb | nd005 | | 1:12000 |
Fram-Cathay loams, 0 to 3 percent slopes | F220A | 3642 | 2587625 | 2q3xc | nd005 | | 1:12000 |
Fram-Tonka complex, 0 to 3 percent slopes | G210A | 2217 | 2573829 | 2px04 | nd005 | | 1:12000 |
Fram loam, saline, 0 to 3 percent slopes | G216A | 1546 | 2573702 | 2px08 | nd005 | | 1:12000 |
Fram-Cathay loams, 0 to 3 percent slopes | G220A | 739 | 2573798 | 2q4hl | nd005 | | 1:12000 |
Fram-Wyard loams, 0 to 3 percent slopes | G211A | 51 | 2575046 | 2px05 | nd017 | 1983 | 1:20000 |
Fram-Wyard loams, 0 to 3 percent slopes | G211A | 25273 | 2575422 | 2px05 | nd027 | | 1:12000 |
Fram-Tonka complex, 0 to 3 percent slopes | G210A | 5001 | 2575421 | 2px04 | nd027 | | 1:12000 |
Fram loam, saline, 0 to 3 percent slopes | G216A | 953 | 2575423 | 2px08 | nd027 | | 1:12000 |
Fram-Wyard loams, 0 to 3 percent slopes | G211A | 53539 | 2576394 | 2px05 | nd031 | 1990 | 1:20000 |
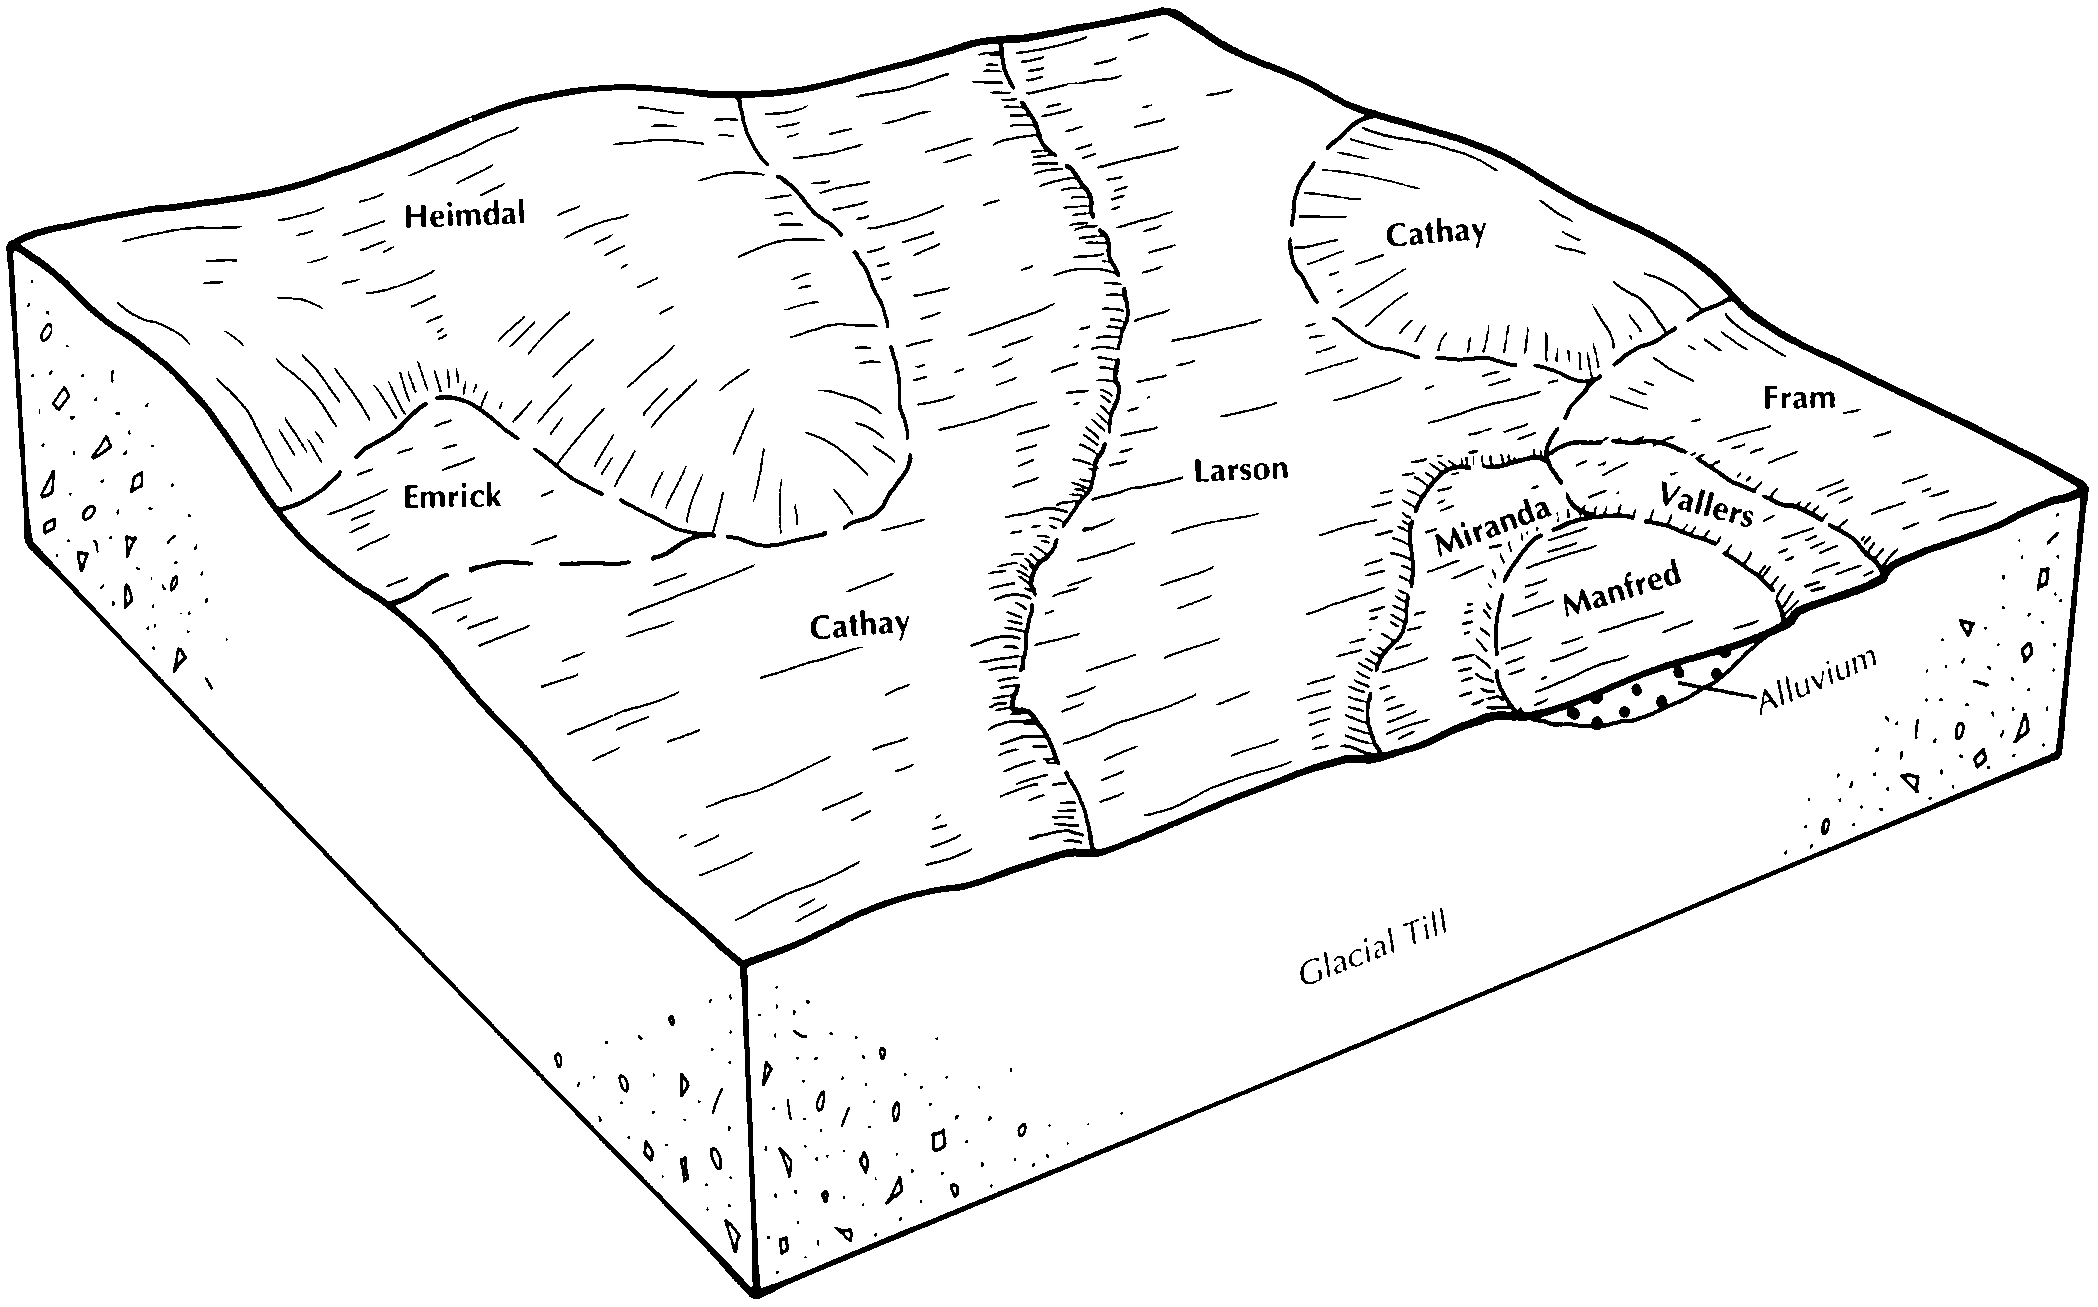
Vallers-Fram loams, saline, 0 to 3 percent slopes | G212A | 11015 | 2576395 | 2px06 | nd031 | 1990 | 1:20000 |
Fram-Tonka-Parnell complex, 0 to 3 percent slopes | G209A | 4859 | 2576392 | 2px03 | nd031 | 1990 | 1:20000 |
Fram-Tonka complex, 0 to 3 percent slopes | G210A | 705 | 2576393 | 2px04 | nd031 | 1990 | 1:20000 |
Fram loam, saline, 0 to 3 percent slopes | G216A | 10 | 2576396 | 2px08 | nd031 | 1990 | 1:20000 |
Fram-Wyard loams, 0 to 3 percent slopes | G211A | 12602 | 2576584 | 2px05 | nd039 | 1991 | 1:24000 |
Fram-Tonka complex, 0 to 3 percent slopes | G210A | 5038 | 2576583 | 2px04 | nd039 | 1991 | 1:24000 |
Vallers-Fram loams, saline, 0 to 3 percent slopes | G212A | 3336 | 2576585 | 2px06 | nd039 | 1991 | 1:24000 |
Fram-Wyard loams, 0 to 3 percent slopes | G211A | 20 | 2577268 | 2px05 | nd063 | | 1:12000 |
Fram loam, saline, 0 to 3 percent slopes | G216A | 15 | 2577269 | 2px08 | nd063 | | 1:12000 |
Fram-Tonka complex, 0 to 3 percent slopes | G210A | 8 | 2577267 | 2px04 | nd063 | | 1:12000 |
Fram-Wyard loams, 0 to 3 percent slopes | F211A | 7020 | 2587213 | 2q3x9 | nd069 | 1975 | 1:20000 |
Fram-Wyard loams, 0 to 3 percent slopes | G211A | 5713 | 2582266 | 2px05 | nd069 | 1975 | 1:20000 |
Fram-Tonka complex, 0 to 3 percent slopes | G210A | 3457 | 2582265 | 2px04 | nd069 | 1975 | 1:20000 |
Fram-Tonka complex, 0 to 3 percent slopes | F210A | 2095 | 2587167 | 2q3x8 | nd069 | 1975 | 1:20000 |
Fram-Cathay loams, 0 to 3 percent slopes | G220A | 22 | 2506008 | 2q4hl | nd069 | 1975 | 1:20000 |
Fram loam, saline, 0 to 3 percent slopes | F216A | 20 | 2587289 | 2q3xb | nd069 | 1975 | 1:20000 |
Fram loam, saline, 0 to 3 percent slopes | G216A | 1 | 2582267 | 2px08 | nd069 | 1975 | 1:20000 |
Fram-Wyard loams, 0 to 3 percent slopes | F211A | 648 | 2588070 | 2q3x9 | nd079 | 1990 | 1:24000 |
Fram loam, saline, 0 to 3 percent slopes | F216A | 219 | 2588211 | 2q3xb | nd079 | 1990 | 1:24000 |
Fram-Tonka complex, 0 to 3 percent slopes | F210A | 125 | 2587986 | 2q3x8 | nd079 | 1990 | 1:24000 |
Fram-Tonka complex, 0 to 3 percent slopes | G210A | 8441 | 2581947 | 2px04 | nd083 | 1990 | 1:20000 |
Fram loam, saline, 0 to 3 percent slopes | G216A | 1805 | 2581949 | 2px08 | nd083 | 1990 | 1:20000 |
Fram-Wyard loams, 0 to 3 percent slopes | G211A | 1674 | 2581948 | 2px05 | nd083 | 1990 | 1:20000 |
Fram loam, moderately saline, 0 to 3 percent slopes | C71A | 186 | 2595577 | 2q6m5 | nd083 | 1990 | 1:20000 |
Fram loam, 0 to 3 percent slopes | C291A | 148 | 2566815 | 2q76p | nd083 | 1990 | 1:20000 |
Fram-Tonka complex, 0 to 3 percent slopes | C294A | 148 | 2566823 | 2q7c9 | nd083 | 1990 | 1:20000 |
Fram-Wyard loams, 0 to 3 percent slopes | G211A | 8305 | 2579734 | 2px05 | nd091 | 1991 | 1:20000 |
Fram-Tonka complex, 0 to 3 percent slopes | G210A | 916 | 2579733 | 2px04 | nd091 | 1991 | 1:20000 |
Vallers-Fram loams, saline, 0 to 3 percent slopes | G212A | 128 | 2579735 | 2px06 | nd091 | 1991 | 1:20000 |
Fram-Tonka complex, 0 to 3 percent slopes | G210A | 16 | 2579826 | 2px04 | nd097 | 1974 | 1:20000 |
Fram-Wyard loams, 0 to 3 percent slopes | G211A | 4 | 2579798 | 2px05 | nd097 | 1974 | 1:20000 |
Fram-Wyard loams, 0 to 3 percent slopes | G211A | 75745 | 2579611 | 2px05 | nd103 | 1966 | 1:12000 |
Fram-Tonka complex, 0 to 3 percent slopes | G210A | 10597 | 2579610 | 2px04 | nd103 | 1966 | 1:12000 |
Fram loam, 0 to 3 percent slopes | C291A | 254 | 2566978 | 2q76p | nd103 | 1966 | 1:12000 |
Fram-Tonka-Parnell complex, 0 to 3 percent slopes | G209A | 56 | 2579609 | 2px03 | nd103 | 1966 | 1:12000 |
Fram loam, saline, 0 to 3 percent slopes | G216A | 19 | 2579613 | 2px08 | nd103 | 1966 | 1:12000 |