| Fivebit-Anatone-Klicker complex, 15 to 50 percent slopes | 1778CO | 339 | 3472476 | 130z2 | or021 | 1978 | 1:24000 |
Bocker-Fivebit-Anatone complex, 15 to 30 percent slopes | 5950BO | 86 | 3472478 | 1qy71 | or021 | 1978 | 1:24000 |
Klickson-Bolobin-Fivebit complex, 15 to 30 percent slopes | 4977BE | 68 | 3472477 | 20bmf | or021 | 1978 | 1:24000 |
Klicker-Fivebit complex, 12 to 35 percent south slopes | 89D | 3147 | 62280 | 22t1 | or604 | 1988 | 1:24000 |
Klicker-Fivebit complex, 35 to 60 percent south slopes | 89E | 2680 | 62281 | 22t2 | or604 | 1988 | 1:24000 |
Fivebit-Rock outcrop complex, 35 to 60 percent south slopes | 52E | 904 | 62228 | 22rc | or604 | 1988 | 1:24000 |
Fivebit-Klicker-Tolo complex, 30 to 60 percent slopes | 1707CO | 566 | 2593870 | 1qzfs | or604 | 1988 | 1:24000 |
Tolo-Klicker-Fivebit complex, 15 to 30 percent slopes | 1706BO | 234 | 2593868 | 1qzfr | or604 | 1988 | 1:24000 |
Klicker-Fivebit-Bocker complex, 0 to 15 percent slopes | 5901AO | 9390 | 3120564 | 1r2c3 | or607 | 2018 | 1:24000 |
Anatone-Fivebit-Bocker complex, 0 to 15 percent slopes | 4919AP | 5634 | 3120484 | 1r13y | or607 | 2018 | 1:24000 |
Bocker-Fivebit-Anatone complex, 15 to 30 percent slopes | 5950BO | 3624 | 3120336 | 1qy71 | or607 | 2018 | 1:24000 |
Parsnip-Fivebit-Bocker complex, 0 to 15 percent slopes | 5956AO | 3509 | 3120581 | 1r2ks | or607 | 2018 | 1:24000 |
Olot-Syrupcreek-Fivebit complex, 0 to 15 percent slopes | 5998AO | 3196 | 3120596 | 1r2p1 | or607 | 2018 | 1:24000 |
Fivebit-Anatone-Bocker complex, 15 to 30 percent slopes | 5957BO | 2110 | 3120582 | 1r2lm | or607 | 2018 | 1:24000 |
Klickson-Bolobin-Fivebit complex, 15 to 30 percent slopes | 4977BE | 1856 | 3120789 | 20bmf | or607 | 2018 | 1:24000 |
Fivebit-Anatone-Bocker complex, 30 to 60 percent slopes | 5957CO | 1797 | 3120583 | 1r2lz | or607 | 2018 | 1:24000 |
Anatone-Fivebit-Bocker complex, 30 to 60 percent slopes | 5963CO | 1655 | 3120584 | 1r2mc | or607 | 2018 | 1:24000 |
Fivebit-Anatone-Tommycork complex, 15 to 30 percent slopes | 6010BO | 688 | 3120748 | 1t1lm | or607 | 2018 | 1:24000 |
Fivebit-Anatone complex, depositonal, 0 to 15 percent slopes | 4928AD | 681 | 3120487 | 1r18m | or607 | 2018 | 1:24000 |
Humarel-Harlow-Fivebit complex, 0 to 15 percent slopes | 3352AO | 64 | 3120432 | 1r02f | or607 | 2018 | 1:24000 |
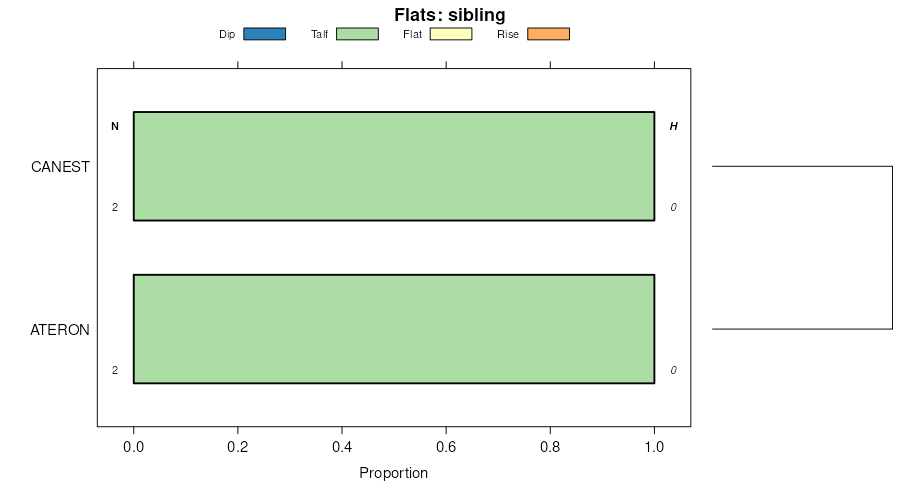
Canest-Fivebit-Anatone complex, 0 to 30 percent slopes | 1773CO | 9 | 3120234 | 1nxyq | or607 | 2018 | 1:24000 |
Harveycreek-Anatone-Fivebit complex, 30 to 60 percent slopes | 1777CO | 6135 | 3426195 | 130yv | or618 | | 1:24000 |
Anatone-Fivebit-Harveycreek complex, 15 to 30 percent slopes | 1777AO | 4060 | 3434828 | 130yt | or618 | | 1:24000 |
Fivebit-Harveycreek-Anatone complex, 15 to 30 percent slopes | 1748BO | 3486 | 3426088 | 130z1 | or618 | | 1:24000 |
Fivebit-Anatone-Nerrad complex, 30 to 60 percent slopes | 1776CO | 1626 | 3426124 | 130ys | or618 | | 1:24000 |
Fivebit-Anatone-Rock outcrop complex, 0 to 15 percent slopes | 1748AO | 977 | 3426109 | 130z0 | or618 | | 1:24000 |
Klicker-Fivebit-Bocker complex, 2 to 20 percent slopes | 423C | 14 | 3426073 | rcv3 | or618 | | 1:24000 |
Anatone-Fivebit-Bocker complex, 30 to 60 percent slopes | 5963CO | 8439 | 3122369 | 1r2mc | or626 | 2018 | 1:24000 |
Anatone-Fivebit-Bocker complex, 0 to 15 percent slopes | 4919AP | 5521 | 3122297 | 1r13y | or626 | 2018 | 1:24000 |
Bocker-Fivebit-Anatone complex, 15 to 30 percent slopes | 5950BO | 4831 | 3122167 | 1qy71 | or626 | 2018 | 1:24000 |
Fivebit-Anatone-Bocker complex, 15 to 30 percent slopes | 5957BO | 4404 | 3385444 | 1r2lm | or626 | 2018 | 1:24000 |
Fivebit-Anatone-Bocker complex, 30 to 60 percent slopes | 5957CO | 3355 | 3385297 | 1r2lz | or626 | 2018 | 1:24000 |
Canest-Fivebit-Anatone complex, 0 to 30 percent slopes | 1773CO | 1884 | 3122091 | 1nxyq | or626 | 2018 | 1:24000 |
Humarel-Harlow-Fivebit complex, 0 to 15 percent slopes | 3352AO | 1159 | 3122229 | 1r02f | or626 | 2018 | 1:24000 |
Klicker-Fivebit-Bocker complex, 2 to 20 percent slopes | 4074AO | 1133 | 3385275 | rcv3 | or626 | 2018 | 1:24000 |
Fivebit-Anatone complex, depositonal, 0 to 15 percent slopes | 4928AD | 233 | 3122300 | 1r18m | or626 | 2018 | 1:24000 |
Olot-Syrupcreek-Fivebit complex, 0 to 15 percent slopes | 5998AO | 82 | 3122375 | 1r2p1 | or626 | 2018 | 1:24000 |
Parsnip-Fivebit-Bocker complex, 0 to 15 percent slopes | 5956AO | 37 | 3122368 | 1r2ks | or626 | 2018 | 1:24000 |
Klickson-Bolobin-Fivebit complex, 15 to 30 percent slopes | 4977BE | 32 | 3122517 | 20bmf | or626 | 2018 | 1:24000 |
Klicker-Fivebit-Bocker complex, 2 to 20 percent slopes | 423C | 16040 | 3425036 | rcv3 | or627 | | 1:24000 |
Olot-Fivebit-Bocker complex, 2 to 20 percent slopes | 438C | 4159 | 3426270 | 1vtl7 | or627 | | 1:24000 |
Larabee-Fivebit complex, 2 to 20 percent slopes | 424C | 2018 | 3426392 | 1vtl4 | or627 | | 1:24000 |
Anatone-Fivebit-Bocker complex, 30 to 60 percent slopes | 5963CO | 1512 | 3425203 | 1r2mc | or627 | | 1:24000 |
Anatone-Fivebit-Bocker complex, 0 to 15 percent slopes | 4919AP | 1035 | 3425219 | 1r13y | or627 | | 1:24000 |
Bocker-Fivebit-Anatone complex, 15 to 30 percent slopes | 5950BO | 1008 | 3425225 | 1qy71 | or627 | | 1:24000 |
Fivebit-Anatone complex, 0 to 15 percent slopes, depositional | 4928AD | 196 | 3429809 | 2ktzf | or627 | | 1:24000 |
Fivebit-Anatone-Bocker complex, 15 to 30 percent slopes | 5957BO | 131 | 3425196 | 1r2lm | or627 | | 1:24000 |
Olot-Syrupcreek-Fivebit complex, 0 to 15 percent slopes | 5998AO | 94 | 3431897 | 1r2p1 | or627 | | 1:24000 |
Canest-Fivebit-Anatone complex, 0 to 30 percent slopes | 1773CO | 11 | 3431917 | 1nxyq | or627 | | 1:24000 |
Fivebit-Klicker-Tolo complex, 30 to 60 percent slopes | 1707CO | 3107 | 2486195 | 1qzfs | or631 | 2018 | 1:24000 |
Tolo-Klicker-Fivebit complex, 15 to 30 percent slopes | 1706BO | 2721 | 2486194 | 1qzfr | or631 | 2018 | 1:24000 |
Fivebit-Bocker-Kamela complex, 15 to 30 percent slopes | 6120BO | 561 | 2437467 | 1sg6w | or631 | 2018 | 1:24000 |
Fivebit-McCartycreek-Rock outcrop complex, 30 to 60 percent slopes | 4195CO | 387 | 2437223 | 1r0zj | or631 | 2018 | 1:24000 |
Klicker-Kamela-Fivebit complex, 60 to 90 percent slopes | 5700DO | 268 | 2437239 | 2l5qd | or631 | 2018 | 1:24000 |
Fivebit-Klicker-Rock outcrop complex, 60 to 90 percent slopes | 4196DR | 203 | 2437224 | 1r0zk | or631 | 2018 | 1:24000 |
Bocker-Fivebit-Anatone complex, 15 to 30 percent slopes | 5950BO | 34 | 2437425 | 1qy71 | or631 | 2018 | 1:24000 |
Klicker-Fivebit-Bocker complex, 0 to 15 percent slopes | 5901AO | 14 | 2486854 | 1r2c3 | or631 | 2018 | 1:24000 |
Anatone-Bocker-Fivebit complex, 30 to 60 percent south slopes | 11 | 8 | 3228230 | 2tx6 | or631 | 2018 | 1:24000 |
Anatone-Fivebit-Bocker complex, 0 to 15 percent slopes | 4919AP | 488 | 3121523 | 1r13y | or648 | 1977 | 1:24000 |
Klickson-Bolobin-Fivebit complex, 15 to 30 percent slopes | 4977BE | 360 | 3121538 | 20bmf | or648 | 1977 | 1:24000 |
Fivebit-Anatone-Bocker complex, 30 to 60 percent slopes | 5957CO | 227 | 3121531 | 1r2lz | or648 | 1977 | 1:24000 |
Bocker-Fivebit-Anatone complex, 15 to 30 percent slopes | 5950BO | 190 | 3121509 | 1qy71 | or648 | 1977 | 1:24000 |
Fivebit-Harveycreek-Anatone complex, 15 to 30 percent slopes | 1748BO | 154 | 3462616 | 130z1 | or666 | 1970 | 1:31680 |
Anatone-Fivebit-Harveycreek complex, 15 to 30 percent slopes | 1777AO | 141 | 3472527 | 130yt | or666 | 1970 | 1:31680 |
Harveycreek-Anatone-Fivebit complex, 30 to 60 percent slopes | 1777CO | 139 | 3472430 | 130yv | or666 | 1970 | 1:31680 |
Klicker-Fivebit-Bocker complex, 0 to 15 percent slopes | 5901AO | 773 | 3121475 | 1r2c3 | or667 | 1984 | 1:20000 |
Bocker-Fivebit-Anatone complex, 15 to 30 percent slopes | 5950BO | 74 | 3121455 | 1qy71 | or667 | 1984 | 1:20000 |
Anatone-Bocker-Fivebit complex, 30 to 60 percent south slopes | 11 | 1818 | 84481 | 2tx6 | or670 | 1999 | 1:24000 |
Anatone-Rock outcrop-Fivebit complex, 60 to 90 percent south slopes | 19 | 948 | 84566 | 2tzy | or670 | 1999 | 1:24000 |
Klicker-Fivebit-Anatone complex, 30 to 60 percent slopes | 161 | 809 | 84536 | 2tyz | or670 | 1999 | 1:24000 |
Klicker-Fivebit-Anatone complex, 0 to 15 percent slopes | 160 | 642 | 84534 | 2tyx | or670 | 1999 | 1:24000 |
Rock outcrop-Anatone-Fivebit complex, scarp, 60 to 90 percent south slopes | 246 | 454 | 84630 | 2v20 | or670 | 1999 | 1:24000 |
Klicker-Kamela-Fivebit complex, 60 to 90 percent slopes | 163 | 331 | 84538 | 2tz1 | or670 | 1999 | 1:24000 |
Anatone-Bocker-Fivebit complex, 0 to 15 percent slopes | 10 | 263 | 84470 | 2twv | or670 | 1999 | 1:24000 |
Klicker-Fivebit-Bocker complex, 2 to 20 percent slopes | 423C | 2082 | 3421848 | rcv3 | or677 | | 1:24000 |
Fivebit-Anatone-Klicker complex, 15 to 50 percent slopes | 1778CO | 1711 | 3421973 | 130z2 | or677 | | 1:24000 |
Fivebit-Anatone-Rock outcrop complex, 0 to 15 percent slopes | 1748AO | 817 | 3424476 | 130z0 | or677 | | 1:24000 |
Anatone-Fivebit-Bocker complex, 0 to 15 percent slopes | 4919AP | 589 | 3424966 | 1r13y | or677 | | 1:24000 |
Fivebit-Anatone-Bocker complex, 15 to 30 percent slopes | 5957BO | 575 | 3424934 | 1r2lm | or677 | | 1:24000 |
Klickson-Bolobin-Fivebit complex, 15 to 30 percent slopes | 4977BE | 464 | 3424937 | 20bmf | or677 | | 1:24000 |
Fivebit-Anatone-Nerrad complex, 30 to 60 percent slopes | 1776CO | 388 | 3424581 | 130ys | or677 | | 1:24000 |
Bocker-Fivebit-Anatone complex, 15 to 30 percent slopes | 5950BO | 371 | 3424972 | 1qy71 | or677 | | 1:24000 |
Fivebit-Anatone-Bocker complex, 30 to 60 percent slopes | 5957CO | 170 | 3424935 | 1r2lz | or677 | | 1:24000 |
Anatone-Fivebit-Bocker complex, 30 to 60 percent slopes | 5963CO | 170 | 3424944 | 1r2mc | or677 | | 1:24000 |
Harveycreek-Anatone-Fivebit complex, 30 to 60 percent slopes | 1777CO | 130 | 3424994 | 130yv | or677 | | 1:24000 |