Official Series Description


Lab Data Summary

Aggregate lab data for the FELDA soil series. This aggregation is based on all pedons with a current taxon name of FELDA, and applied along 1-cm thick depth slices. Solid lines are the slice-wise median, bounded on either side by the interval defined by the slice-wise 5th and 95th percentiles. The median is the value that splits the data in half. Five percent of the data are less than the 5th percentile, and five percent of the data are greater than the 95th percentile. Values along the right hand side y-axis describe the proportion of pedon data that contribute to aggregate values at this depth. For example, a value of "90%" at 25cm means that 90% of the pedons correlated to FELDA were used in the calculation. Source: KSSL snapshot . Methods used to assemble the KSSL snapshot used by SoilWeb / SDE

Click the image to view it full size.

Pedons used in the lab summary:

MLRALab IDPedon IDTaxonnameCINSSL / NASIS ReportsLink To SoilWeb GMap
154S51_0071977-FL101-S51_007Felda3Primary | Supplementary | Taxonomy | Pedon | Water Retention | Correlation | Andic Soil Properties28.2572422,-82.3907547
155S26_0071980-FL051-S26_007Felda3Primary | Supplementary | Taxonomy | Pedon | Water Retention | Correlation | Andic Soil Properties26.7606201,-81.4492722
15540A5064S1953FL115021FELDA4Primary | Supplementary | Taxonomy | Pedon | Water Retention | Correlation | Andic Soil Properties27.2197723,-82.3654175
15540A5065S1953FL115023FELDA4Primary | Supplementary | Taxonomy | Pedon | Water Retention | Correlation | Andic Soil Properties27.3825455,-82.4615326
15540A5066S1953FL115024FELDA4Primary | Supplementary | Taxonomy | Pedon | Water Retention | Correlation | Andic Soil Properties27.2572708,-82.3720856
15540A5067S1953FL115026FELDA4Primary | Supplementary | Taxonomy | Pedon | Water Retention | Correlation | Andic Soil Properties27.2572708,-82.3504181
155S08_003S1978FL015003Felda3Primary | Supplementary | Taxonomy | Pedon | Water Retention | Correlation | Andic Soil Properties26.9209366,-81.9636383
155S25_200S1979FL049200Felda3Primary | Supplementary | Taxonomy | Pedon | Water Retention | Correlation | Andic Soil Properties27.60393,-82.0339
155S28_010S1984FL055010Felda3Primary | Supplementary | Taxonomy | Pedon | Water Retention | Correlation | Andic Soil Properties27.2110424,-81.1501694
155S22_004S1988FL043004Felda3Primary | Supplementary | Taxonomy | Pedon | Water Retention | Correlation | Andic Soil Properties27.0601807,-81.0612106
15589P0332S1989FL043001Felda3Primary | Supplementary | Taxonomy | Pedon | Water Retention | Correlation | Andic Soil Properties26.9528351,-81.1162186
156BS05_0051967-FL009-S05_005Felda3Primary | Supplementary | Taxonomy | Pedon | Water Retention | Correlation | Andic Soil Properties28.296587,-80.7462616
156BS43_0271983-FL085-S43_027Felda3Primary | Supplementary | Taxonomy | Pedon | Water Retention | Correlation | Andic Soil Properties27.0829773,-80.445343
n/a40A4252S1971FL099017FELDA5Primary | Supplementary | Taxonomy | Pedon | Water Retention | Correlation | Andic Soil Propertiesn/a
n/a40A4254S1971FL099019FELDA6Primary | Supplementary | Taxonomy | Pedon | Water Retention | Correlation | Andic Soil Propertiesn/a

Water Balance

Monthly water balance estimated using a leaky-bucket style model for the FELDA soil series. Monthly precipitation (PPT) and potential evapotranspiration (PET) have been estimated from the 50th percentile of gridded values (PRISM 1981-2010) overlapping with the extent of SSURGO map units containing each series as a major component. Monthly PET values were estimated using the method of Thornthwaite (1948). These (and other) climatic parameters are calculated with each SSURGO refresh and provided by the fetchOSD function of the soilDB package. Representative water storage values (“AWC” in the figures) were derived from SSURGO by taking the 50th percentile of profile-total water storage (sum[awc_r * horizon thickness]) for each soil series. Note that this representation of “water storage” is based on the average ability of most plants to extract soil water between 15 bar (“permanent wilting point”) and 1/3 bar (“field capacity”) matric potential. Soil moisture state can be roughly interpreted as “dry” when storage is depleted, “moist” when storage is between 0mm and AWC, and “wet” when there is a surplus. Clearly there are a lot of assumptions baked into this kind of monthly water balance. This is still a work in progress.

Click the image to view it full size.


Click the image to view it full size.

Sibling Summary

Siblings are those soil series that occur together in map units, in this case with the FELDA series. Sketches are arranged according to their subgroup-level taxonomic structure. Source: SSURGO snapshot , parsed OSD records and snapshot of SC database .

Click the image to view it full size.

Select annual climate data summaries for the FELDA series and siblings. Series are sorted according to hierarchical clustering of median values. Source: SSURGO map unit geometry and 1981-2010, 800m PRISM data .

Click the image to view it full size.

Geomorphic description summaries for the FELDA series and siblings. Series are sorted according to hierarchical clustering of proportions and relative hydrologic position within an idealized landform (e.g. top to bottom). Most soil series (SSURGO components) are associated with a hillslope position and one or more landform-specific positions: hills, mountain slopes, terraces, and/or flats. Proportions can be interpreted as an aggregate representation of geomorphic membership. The values printed to the left (number of component records) and right (Shannon entropy) of stacked bars can be used to judge the reliability of trends. Small Shannon entropy values suggest relatively consistent geomorphic association, while larger values suggest lack thereof. Source: SSURGO component records .

Click the image to view it full size.

Click the image to view it full size.

There are insufficient data to create the 3D mountains figure.

Click the image to view it full size.

Click the image to view it full size.

Competing Series

Soil series competing with FELDA share the same family level classification in Soil Taxonomy. Source: parsed OSD records and snapshot of the SC database .

Click the image to view it full size.

Select annual climate data summaries for the FELDA series and competing. Series are sorted according to hierarchical clustering of median values. Source: SSURGO map unit geometry and 1981-2010, 800m PRISM data .

Click the image to view it full size.

Geomorphic description summaries for the FELDA series and competing. Series are sorted according to hierarchical clustering of proportions and relative hydrologic position within an idealized landform (e.g. top to bottom). Proportions can be interpreted as an aggregate representation of geomorphic membership. Most soil series (SSURGO components) are associated with a hillslope position and one or more landform-specific positions: hills, mountain slopes, terraces, and/or flats. The values printed to the left (number of component records) and right (Shannon entropy) of stacked bars can be used to judge the reliability of trends. Shannon entropy values close to 0 represent soil series with relatively consistent geomorphic association, while values close to 1 suggest lack thereof. Source: SSURGO component records .

There are insufficient data to create the 2D hillslope position figure.

There are insufficient data to create the 3D hills figure.

There are insufficient data to create the 3D mountains figure.

Click the image to view it full size.

Click the image to view it full size.

Soil series sharing subgroup-level classification with FELDA, arranged according to family differentiae. Hovering over a series name will print full classification and a small sketch from the OSD. Source: snapshot of SC database .

Block Diagrams

Click a link below to display the diagram. Note that these diagrams may be from multiple survey areas.

  1. FL-2011-05-31-03 | Hardee County - 1984

    Relationship of soils to topography and parent material in the Pomona-Floridana-Popash general soil map unit (Soil Survey of Hardee County, Florida; 1984).

  2. FL-2012-04-25-30 | Polk County - October 1990

    Relationship of soils to topography (Soil Survey of Polk County, Florida; October 1990).

Map Units

Map units containing FELDA as a major component. Limited to 250 records.

Map Unit Name Symbol Map Unit Area (ac) Map Unit Key National Map Unit Symbol Soil Survey Area Publication Date Map Scale
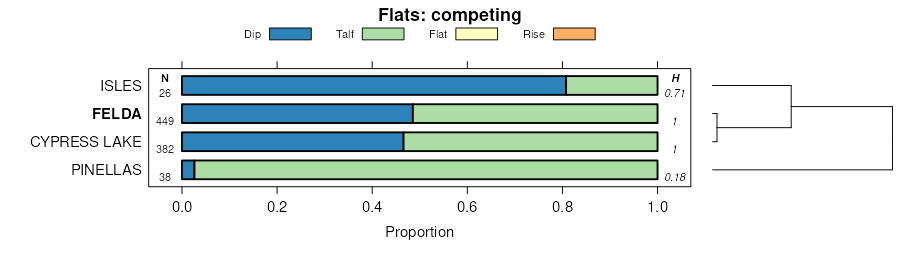
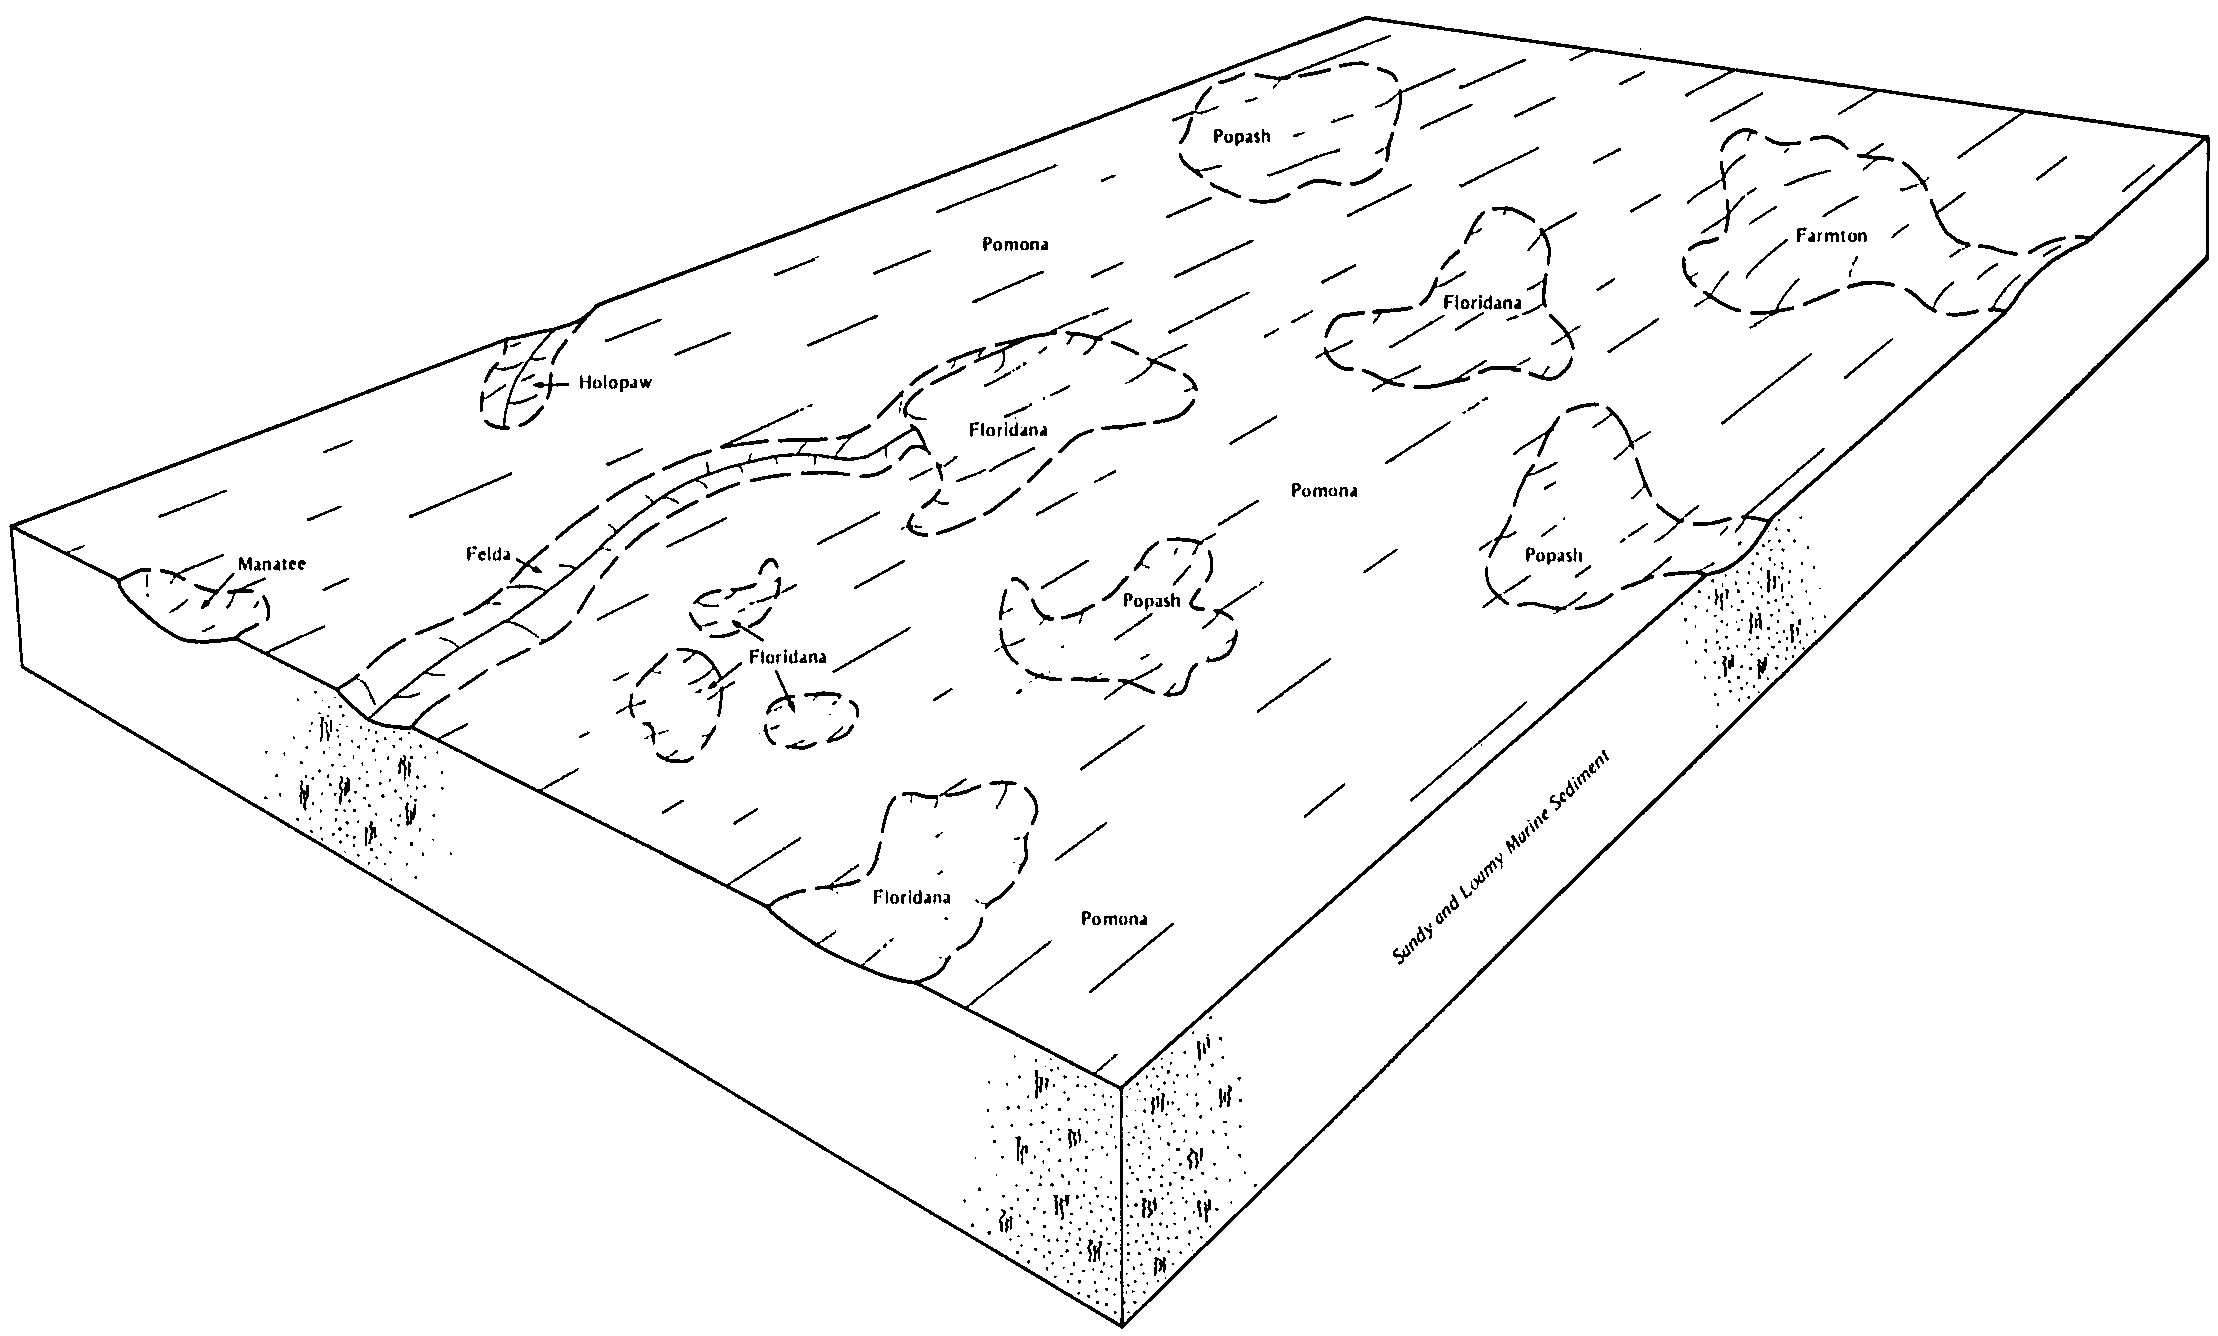
Floridana, Chobee, and Felda soils, frequently flooded241354014733101lg34fl00919901:24000
Felda fine sand, frequently ponded, 0 to 1 percent slopes49914714534632tzxbfl01519821:20000
Felda fine sand, 0 to 2 percent slopes12562514534322tzvyfl01519821:20000
Felda fine sand-Urban land complex, 0 to 2 percent slopes110273430458422x9ccfl01519821:20000
Felda fine sand, ponded-Urban land complex, 0 to 1 percent slopes11145330458432x9dvfl01519821:20000
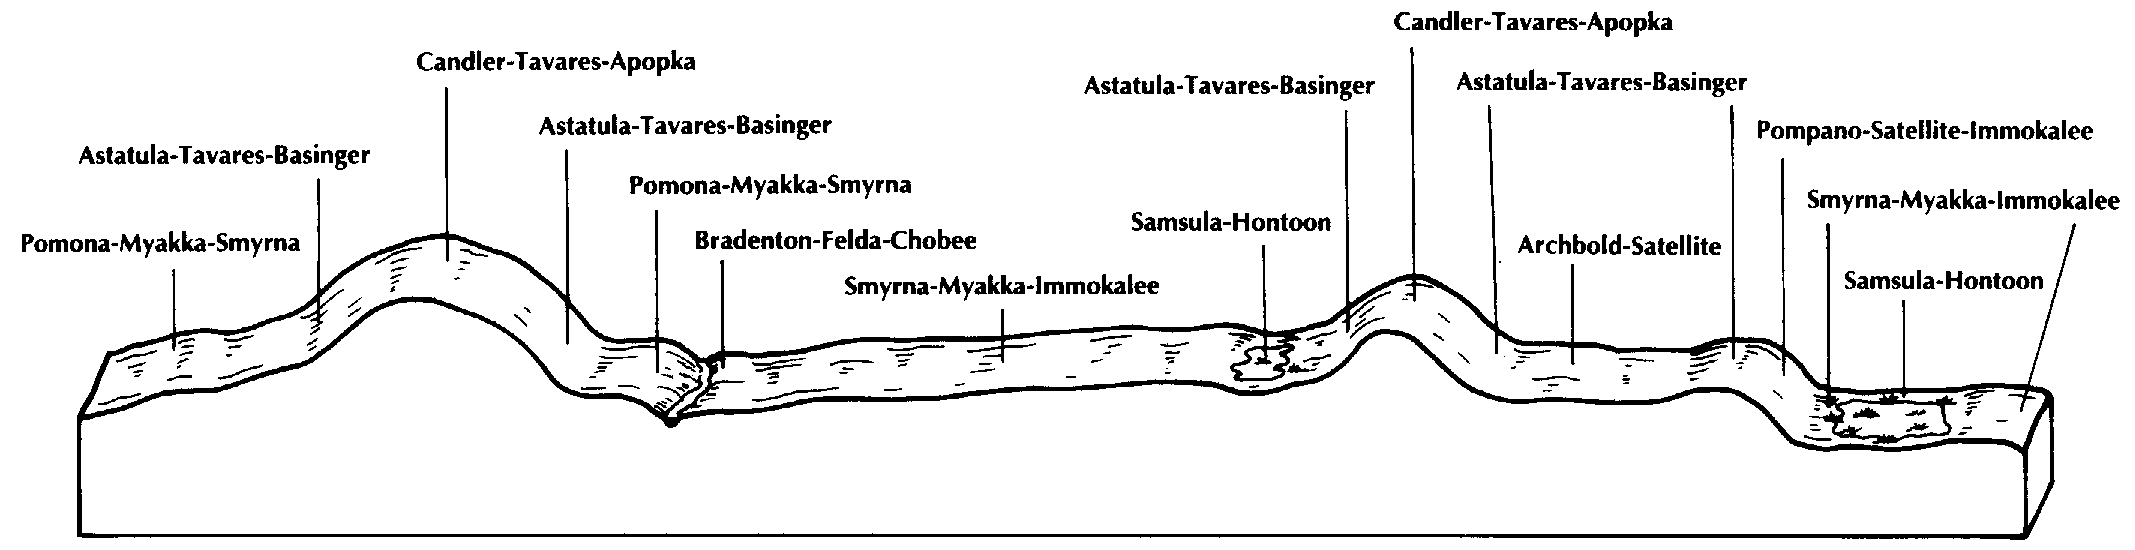
Bradenton-Felda-Chobee complex, frequently flooded8902013869021hk5sfl02719861:24000
Felda fine sand, 0 to 2 percent slopes15732013869092tzvyfl02719861:24000
Bradenton-Felda-Chobee complex, occasionally flooded7663013869011hk5rfl02719861:24000
Felda fine sand, frequently ponded, 0 to 1 percent slopes17278013869112tzxbfl02719861:24000
Felda fine sand, 0 to 2 percent slopes, frequently flooded1685013869102tzxcfl02719861:24000
Felda fine sand, 0 to 2 percent slopes102716014535692tzvyfl04319911:24000
Floridana, Astor, and Felda soils, frequently flooded321674014535861kskwfl04319911:24000
Bradenton-Felda-Chobee association, frequently flooded274081013844051hgl7fl04919811:20000
Felda fine sand, 0 to 2 percent slopes, frequently flooded12789013843912tzxcfl04919811:20000
Felda fine sand, 0 to 2 percent slopes11622013843902tzvyfl04919811:20000
Felda fine sand, frequently ponded, 0 to 1 percent slopes32315013844102tzxbfl04919811:20000
Felda fine sand, 0 to 2 percent slopes132527914135132tzvyfl05519821:24000
Felda fine sand, frequently ponded, 0 to 1 percent slopes31353714135302tzxbfl05519821:24000
Felda fine sand, 0 to 2 percent slopes15498014069642tzvyfl05719861:20000
Felda fine sand, 0 to 2 percent slopes, occasionally flooded16126014069652tzxdfl05719861:20000
Felda fine sand, frequently ponded, 0 to 1 percent slopes49780714834422tzxbfl07119821:20000
Felda fine sand, ponded-Urban land complex, 0 to 1 percent slopes111247431028522x9dvfl07119821:20000
Felda fine sand, 0 to 2 percent slopes12237814834092tzvyfl07119821:20000
Felda fine sand-Urban land complex, 0 to 2 percent slopes110141031028532x9ccfl07119821:20000
Felda-Wabasso association, frequently flooded241543013840921hg84fl08119811:24000
Felda fine sand, 0 to 2 percent slopes22265913840902tzvyfl08119811:24000
Felda-Palmetto complex23259113840911hg83fl08119811:24000
Felda fine sand, 0 to 2 percent slopes, frequently flooded1562923231272tzxcfl09519861:20000
Felda fine sand, 0 to 2 percent slopes1326523231252tzvyfl09519861:20000
Felda fine sand, 0 to 2 percent slopes, occasionally flooded1415423231262tzxdfl09519861:20000
Felda fine sand, 0 to 2 percent slopes419753232092tzvyfl10119801:20000
Felda fine sand, frequently ponded, 0 to 1 percent slopes12174010170862tzxbfl10320031:24000
Felda soils and Urban land1110101017087134c8fl10320031:24000
Felda fine sand, frequently ponded, 0 to 1 percent slopes861141114250682tzxbfl10519871:20000
Felda fine sand421120114250321jtvsfl10519871:20000
Felda fine sand, 0 to 2 percent slopes, frequently flooded82652214250652tzxcfl10519871:20000
Bradenton-Felda-Chobee association, frequently flooded72367114250561jtwkfl10519871:20000
Felda fine sand, frequently ponded, 0 to 1 percent slopes121350014600902tzxbfl11519881:24000
Felda fine sand, ponded-Urban land complex, 0 to 1 percent slopes57353831030122x9dvfl11519881:24000
Felda, Pompano fine sands, 0 to 2 percent slopes and Frequently flooded13198631029952y9gyfl11519881:24000
Felda, wet-Felda fine sand complex, 0 to 2 percent slopes11102831030082y9g8fl11519881:24000
Felda, wet-Felda fine sand-Urban land complex, 0 to 2 percent slopes5678731030072y9g9fl11519881:24000
Felda-Pompano fine sands-Urban land complex, 0 to 2 percent slopes, frequently flooded5817431030132y9hqfl11519881:24000
Felda and Manatee mucky fine sands, depressional15506314786991lmpzfl11719861:20000
Felda fine sand, saline, frequently flooded1465114786981lmpyfl11719861:20000
Anclote and Myakka soils42340916031311qt5xfl60719701:20000
Felda fine sand15171215422691nrvmfl60719701:20000

Map of Series Extent

Approximate geographic distribution of the FELDA soil series. To learn more about how this distribution was mapped, or to compare this soil series extent to others, use the Series Extent Explorer (SEE) application. Source: generalization of SSURGO geometry .