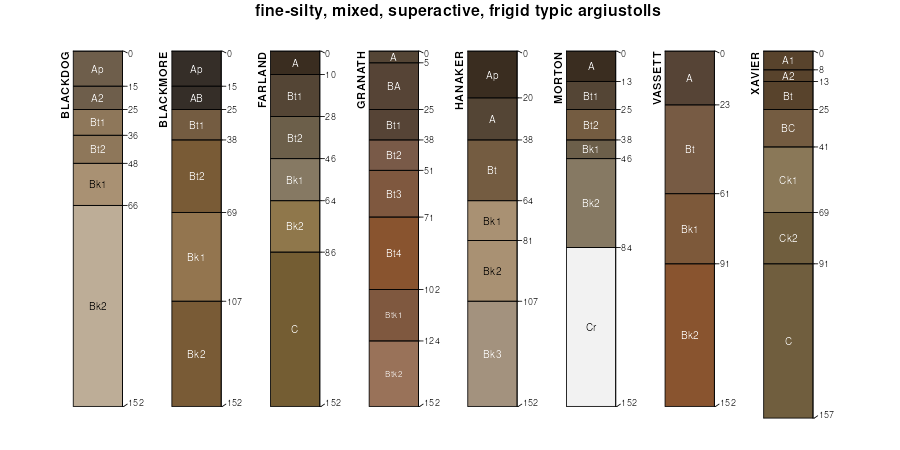
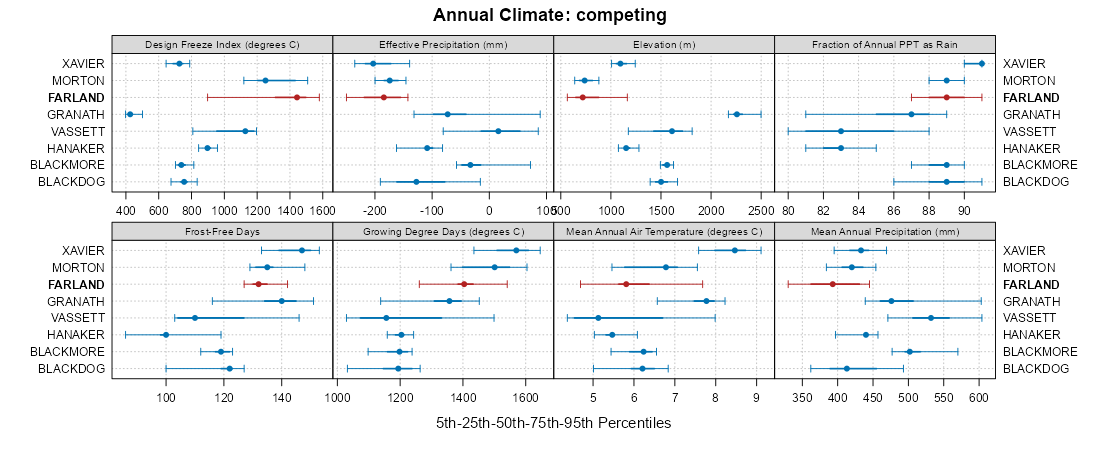
| Farland silt loam, 2 to 8 percent slopes | 59C | 5076 | 343557 | cjhh | mt017 | 1995 | 1:24000 |
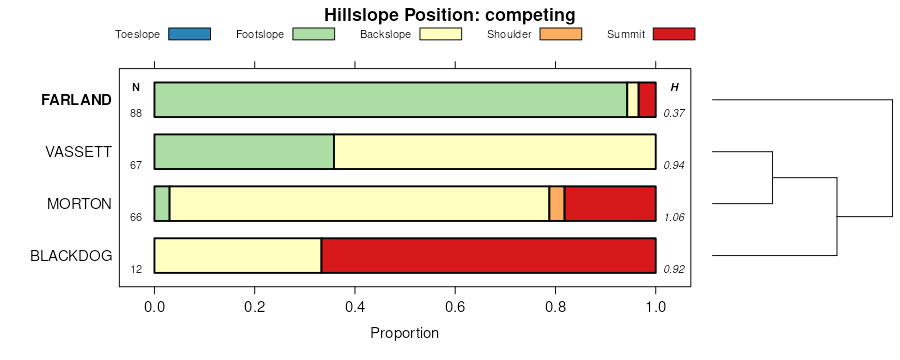
Morton-Farland silt loams, 2 to 8 percent slopes | 871C | 2228 | 343725 | cjnx | mt017 | 1995 | 1:24000 |
Farland silt loam, 0 to 4 percent slopes | 63 | 2122 | 344428 | ckdl | mt055 | 1981 | 1:24000 |
Farland and Havrelon soils, 4 to 8 percent slopes | Fm | 39140 | 347852 | cnz1 | mt643 | 1967 | 1:20000 |
Farland-Cabba association, 8 to 20 percent slopes | Fk | 18207 | 347850 | cnyz | mt643 | 1967 | 1:20000 |
Farland silt loam, 4 to 8 percent slopes | Fe | 10817 | 347848 | cnyx | mt643 | 1967 | 1:20000 |
Farland-Rockland association, 0 to 6 percent slopes | Fl | 6309 | 347851 | cnz0 | mt643 | 1967 | 1:20000 |
Farland-Cabba association, 4 to 8 percent slopes | Fh | 5888 | 347849 | cnyy | mt643 | 1967 | 1:20000 |
Farland silt loam, 2 to 4 percent slopes | Fd | 5849 | 347847 | cnyw | mt643 | 1967 | 1:20000 |
Farland silt loam, 0 to 2 percent slopes | Fa | 1253 | 347846 | cnyv | mt643 | 1967 | 1:20000 |
Farland-Cherry silt loams, 2 to 8 percent slopes | 17 | 108358 | 348219 | cpbw | mt661 | 1982 | 1:24000 |
Farland silt loam, 2 to 8 percent slopes | 16 | 42455 | 348218 | cpbv | mt661 | 1982 | 1:24000 |
Belfield-Daglum-Farland silt loams, 0 to 2 percent slopes | E0403A | 7819 | 2563527 | 2r4g0 | nd011 | 1969 | 1:20000 |
Belfield-Daglum-Farland silt loams, 2 to 6 percent slopes | E0403B | 3922 | 2563528 | 2r4g1 | nd011 | 1969 | 1:20000 |
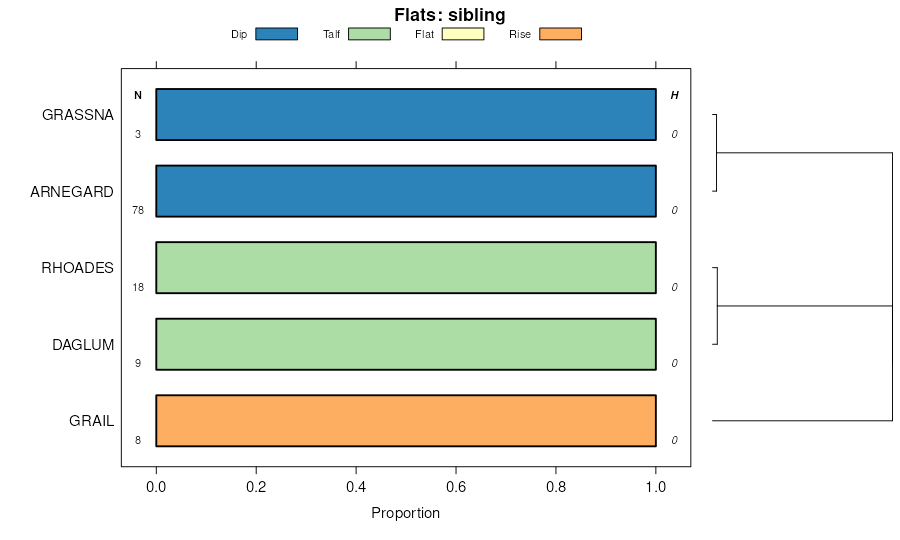
Grail-Farland silt loams, 2 to 6 percent slopes | E0814B | 941 | 2563557 | 2rdbd | nd011 | 1969 | 1:20000 |
Morton-Farland silt loams, 3 to 6 percent slopes | E2927B | 199 | 2661698 | 1vzv5 | nd015 | 1967 | 1:20000 |
Morton-Farland silt loams, 3 to 6 percent slopes | E2927B | 17686 | 2707210 | 1vzv5 | nd025 | 1981 | 1:20000 |
Farland silt loam, 0 to 2 percent slopes | E2203A | 8197 | 2707203 | 1vztg | nd025 | 1981 | 1:20000 |
Belfield-Daglum-Farland silt loams, 0 to 2 percent slopes | E0403A | 5701 | 2707165 | 2r4g0 | nd025 | 1981 | 1:20000 |
Farland silt loam, 2 to 6 percent slopes | E2203B | 4713 | 2707204 | 1vzth | nd025 | 1981 | 1:20000 |
Morton-Farland silt loams, 0 to 3 percent slopes | E2927A | 1264 | 2707209 | 1vzv4 | nd025 | 1981 | 1:20000 |
Farland silt loam, 2 to 6 percent slopes | E2203B | 1939 | 2661780 | 1vzth | nd029 | 1979 | 1:20000 |
Farland silt loam, 0 to 6 percent slopes | C466B | 208 | 2564344 | 2q6l8 | nd029 | 1979 | 1:20000 |
Farland silt loam, 0 to 2 percent slopes | E2203A | 32 | 2661779 | 1vztg | nd029 | 1979 | 1:20000 |
Morton-Farland silt loams, 3 to 6 percent slopes | E2927B | 10 | 1715500 | 1vzv5 | nd037 | 1985 | 1:20000 |
Farland silt loam, 6 to 9 percent slopes | E2203C | 5 | 2759645 | 1vztj | nd037 | 1985 | 1:20000 |
Morton-Farland silt loams, 3 to 6 percent slopes | E2927B | 25 | 2755686 | 1vzv5 | nd041 | 1986 | 1:20000 |
Morton-Farland silt loams, 0 to 3 percent slopes | E2927A | 19 | 2755685 | 1vzv4 | nd041 | 1986 | 1:20000 |
Farland silt loam, 0 to 2 percent slopes | E2203A | 2 | 2755681 | 1vztg | nd041 | 1986 | 1:20000 |
Farland silt loam, 2 to 6 percent slopes | E2203B | 23002 | 2699163 | 1vzth | nd059 | 1998 | 1:20000 |
Morton-Farland silt loams, 3 to 6 percent slopes | E2927B | 11552 | 1718358 | 1vzv5 | nd059 | 1998 | 1:20000 |
Farland silt loam, 0 to 2 percent slopes | E2203A | 10460 | 1718350 | 1vztg | nd059 | 1998 | 1:20000 |
Farland silt loam, 6 to 9 percent slopes | E2203C | 8314 | 2699164 | 1vztj | nd059 | 1998 | 1:20000 |
Farland silt loam, 9 to 15 percent slopes | E2203D | 1952 | 2699165 | cdnd | nd059 | 1998 | 1:20000 |
Grail-Farland silt loams, 2 to 6 percent slopes | E0814B | 3 | 2759665 | 2rdbd | nd059 | 1998 | 1:20000 |
Belfield-Daglum-Farland silt loams, 0 to 2 percent slopes | E0403A | 287 | 2662535 | 2r4g0 | nd061 | 1988 | 1:24000 |
Morton-Farland silt loams, 3 to 6 percent slopes | E2927B | 9374 | 2525954 | 1vzv5 | nd065 | 1971 | 1:20000 |
Grail-Farland silt loams, 2 to 6 percent slopes | E0814B | 3103 | 2525911 | 2rdbd | nd065 | 1971 | 1:20000 |
Farland silt loam, 0 to 2 percent slopes | E2203A | 1259 | 2525938 | 1vztg | nd065 | 1971 | 1:20000 |
Morton-Farland silt loams, 0 to 3 percent slopes | E2927A | 717 | 2525953 | 1vzv4 | nd065 | 1971 | 1:20000 |
Farland silt loam, 2 to 6 percent slopes | E2203B | 265 | 2525939 | 1vzth | nd065 | 1971 | 1:20000 |
Belfield-Daglum-Farland silt loams, 0 to 2 percent slopes | E0403A | 18512 | 2707357 | 2r4g0 | nd087 | 1974 | 1:20000 |
Belfield-Daglum-Farland silt loams, 2 to 6 percent slopes | E0403B | 10740 | 2707358 | 2r4g1 | nd087 | 1974 | 1:20000 |
Morton-Farland silt loams, 3 to 6 percent slopes | E2927B | 6174 | 2715835 | 1vzv5 | nd087 | 1974 | 1:20000 |
Farland silt loam, 0 to 2 percent slopes | E2203A | 3716 | 2707416 | 1vztg | nd087 | 1974 | 1:20000 |
Morton-Farland silt loams, 0 to 3 percent slopes | E2927A | 2161 | 2715834 | 1vzv4 | nd087 | 1974 | 1:20000 |
Grail-Farland silt loams, 2 to 6 percent slopes | E0814B | 895 | 2707380 | 2rdbd | nd087 | 1974 | 1:20000 |
Farland silt loam, 2 to 6 percent slopes | E2203B | 641 | 2707417 | 1vzth | nd087 | 1974 | 1:20000 |
Morton-Farland silt loams, 3 to 6 percent slopes | E2927B | 1358 | 1713541 | 1vzv5 | nd089 | 1965 | 1:20000 |
Farland silt loam, 0 to 2 percent slopes | E2203A | 495 | 1713519 | 1vztg | nd089 | 1965 | 1:20000 |
Morton-Farland silt loams, 0 to 3 percent slopes | E2927A | 305 | 1713540 | 1vzv4 | nd089 | 1965 | 1:20000 |
Farland silt loam, 2 to 6 percent slopes | E2203B | 92 | 1713520 | 1vzth | nd089 | 1965 | 1:20000 |
Farland silt loam, 6 to 9 percent slopes | E2203C | 78 | 1713521 | 1vztj | nd089 | 1965 | 1:20000 |
Farland silt loam, 2 to 6 percent slopes | E2203B | 3361 | 2662567 | 1vzth | nd105 | 1993 | 1:24000 |
Farland silt loam, 0 to 6 percent slopes | 669 | 1533 | 339143 | ccx3 | nd105 | 1993 | 1:24000 |
Farland silt loam, 0 to 6 percent slopes | C466B | 513 | 2567033 | 2q6l8 | nd105 | 1993 | 1:24000 |
Morton-Farland silt loams, 0 to 2 percent slopes | MfA | 4534 | 354211 | cwl5 | sd041 | 1972 | 1:24000 |
Farland silt loam, 0 to 2 percent slopes | FaA | 2330 | 354190 | 2zr09 | sd041 | 1972 | 1:24000 |
Farland silt loam, 2 to 6 percent slopes | FaB | 991 | 354191 | 2zr0b | sd041 | 1972 | 1:24000 |
Farland silt loam, 0 to 2 percent slopes | FaA | 2234 | 355840 | 2zr09 | sd137 | 1985 | 1:24000 |
Farland silt loam, 2 to 6 percent slopes | FaB | 1031 | 355841 | 2zr0b | sd137 | 1985 | 1:24000 |