| Delmont-Enet loams, 2 to 6 percent slopes | DmB | 10395 | 354841 | 2wkr4 | sd003 | 1979 | 1:20000 |
Delmont-Enet loams, 0 to 2 percent slopes | DmA | 2581 | 354840 | 2wkr3 | sd003 | 1979 | 1:20000 |
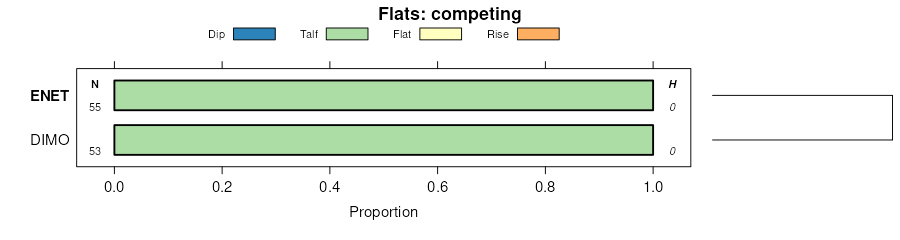
Enet loam, 0 to 2 percent slopes | EnA | 1624 | 354848 | 2wkrt | sd003 | 1979 | 1:20000 |
Enet loam, 0 to 2 percent slopes | EnA | 13390 | 354570 | 2wkrt | sd005 | 1976 | 1:20000 |
Enet loam, 2 to 6 percent slopes | EnB | 1147 | 354571 | 2xhdh | sd005 | 1976 | 1:20000 |
Delmont-Enet loams, 2 to 6 percent slopes | EdB | 1654 | 418265 | 2wkr4 | sd009 | 1981 | 1:20000 |
Delmont-Enet loams, 0 to 2 percent slopes | EdA | 1630 | 418264 | 2wkr3 | sd009 | 1981 | 1:20000 |
Enet loam, 0 to 2 percent slopes, rarely flooded | EnA | 103 | 418751 | 316sm | sd011 | 1995 | 1:24000 |
Enet-Delmont loams, 2 to 9 percent slopes | EnC | 1180 | 355023 | cxfc | sd023 | 1980 | 1:20000 |
Enet loam, 0 to 2 percent slopes | EmA | 765 | 355022 | 2wkrt | sd023 | 1980 | 1:20000 |
Arlo-Enet loams, 0 to 2 percent slopes | AsA | 267 | 355002 | cxdp | sd023 | 1980 | 1:20000 |
Delmont-Enet loams, 2 to 6 percent slopes | DeB | 128 | 417716 | 2wkr4 | sd025 | 1992 | 1:20000 |
Delmont-Enet loams, 0 to 2 percent slopes | DeA | 18 | 417715 | 2wkr3 | sd025 | 1992 | 1:20000 |
Delmont-Enet loams, 2 to 6 percent slopes | DmB | 849 | 445545 | 316sr | sd027 | 1995 | 1:24000 |
Enet loam, 0 to 2 percent slopes, rarely flooded | Em | 433 | 445559 | 316sm | sd027 | 1995 | 1:24000 |
Enet-Storla-Tetonka complex, 0 to 6 percent slopes | EnB | 198 | 445560 | gymx | sd027 | 1995 | 1:24000 |
Enet loam, 0 to 2 percent slopes | EnA | 11787 | 352914 | 2wkrt | sd035 | 1966 | 1:20000 |
Delmont-Enet loams, 0 to 2 percent slopes | EoA | 1306 | 352915 | 2wkr3 | sd035 | 1966 | 1:20000 |
Delmont-Enet loams, 2 to 6 percent slopes | EoB | 850 | 352916 | 2wkr4 | sd035 | 1966 | 1:20000 |
Delmont-Enet loams, 0 to 2 percent slopes | EdA | 3461 | 354895 | 2wkr3 | sd043 | 1979 | 1:20000 |
Delmont-Enet loams, 2 to 6 percent slopes | DlB | 965 | 354889 | 2wkr4 | sd043 | 1979 | 1:20000 |
Delmont-Enet loams, 2 to 6 percent slopes | LhB | 29 | 354269 | 2wkr4 | sd045 | 1973 | 1:20000 |
Enet loam, 0 to 2 percent slopes | BoA | 712 | 355168 | 2wkrt | sd049 | 1981 | 1:20000 |
Enet loam, 0 to 2 percent slopes | WeA | 2214 | 352685 | 2wkrt | sd059 | 1959 | 1:20000 |
Delmont-Enet loams, 2 to 6 percent slopes | Sw | 1614 | 352680 | 2wkr4 | sd059 | 1959 | 1:20000 |
Delmont-Enet loams, 0 to 2 percent slopes | WgA | 654 | 352687 | 2wkr3 | sd059 | 1959 | 1:20000 |
Enet loam, 2 to 6 percent slopes | WeB | 652 | 352686 | 2xhdh | sd059 | 1959 | 1:20000 |
Enet loam, 0 to 2 percent slopes | EnA | 3692 | 356428 | 2wkrt | sd073 | 1987 | 1:20000 |
Delmont-Enet loams, 2 to 6 percent slopes | EpB | 2804 | 356429 | 2wkr4 | sd073 | 1987 | 1:20000 |
Delmont-Enet loams, 0 to 2 percent slopes | DgA | 796 | 356420 | 2wkr3 | sd073 | 1987 | 1:20000 |
Enet loam, high precipitation, 0 to 2 percent slopes | EnhA | 332 | 3082541 | 2xhdl | sd079 | 1967 | 1:20000 |
Enet loam, 0 to 2 percent slopes | EnA | 238 | 416494 | 2wkrt | sd079 | 1967 | 1:20000 |
Delmont-Enet loams, 0 to 2 percent slopes | DnA | 2494 | 418023 | 2wkr3 | sd087 | 1976 | 1:20000 |
Delmont-Enet loams, 0 to 2 percent slopes | EdA | 9321 | 355397 | 2wkr3 | sd097 | 1983 | 1:20000 |
Delmont-Enet loams, 2 to 6 percent slopes | DeB | 1074 | 446022 | 316sr | sd099 | 1995 | 1:24000 |
Delmont-Enet loams, 0 to 2 percent slopes | DeA | 797 | 446021 | 316sp | sd099 | 1995 | 1:24000 |
Enet-Dimo complex, 0 to 2 percent slopes | EoA | 358 | 446037 | gz49 | sd099 | 1995 | 1:24000 |
Enet loam, 0 to 2 percent slopes, rarely flooded | EnA | 336 | 446036 | 316sm | sd099 | 1995 | 1:24000 |
Enet loam, 0 to 2 percent slopes, rarely flooded | EnA | 1763 | 418322 | 316sm | sd101 | 1985 | 1:20000 |
Enet-Dimo complex, 0 to 2 percent slopes | EoA | 915 | 418323 | g199 | sd101 | 1985 | 1:20000 |
Delmont-Enet loams, 2 to 6 percent slopes | EdB | 3210 | 354784 | 2wkr4 | sd111 | 1978 | 1:20000 |
Enet loam, 0 to 2 percent slopes | EcA | 1453 | 354783 | 2wkrt | sd111 | 1978 | 1:20000 |
Delmont-Enet loams, 0 to 2 percent slopes | DeA | 4083 | 356586 | 2wkr3 | sd115 | 1997 | 1:24000 |
Delmont-Enet loams, high precipitation, 0 to 2 percent slopes | DlA | 12013 | 3082507 | 2xhdj | sd125 | 1980 | 1:20000 |
Delmont-Enet loams, high precipitation, 2 to 6 percent slopes | DehB | 4077 | 3082553 | 2xhdk | sd125 | 1980 | 1:20000 |
Delmont-Enet loams, 2 to 6 percent slopes | DeB | 1059 | 418224 | 2wkr4 | sd125 | 1980 | 1:20000 |
Enet loam, high precipitation, 0 to 2 percent slopes | EnhA | 523 | 3082539 | 2xhdl | sd125 | 1980 | 1:20000 |
Delmont-Enet loams, 0 to 2 percent slopes | DeA | 360 | 418223 | 2wkr3 | sd125 | 1980 | 1:20000 |
Enet loam, 0 to 2 percent slopes | EnA | 142 | 418231 | 2wkrt | sd125 | 1980 | 1:20000 |
Enet loam, 0 to 2 percent slopes, rarely flooded | EmA | 632 | 453691 | 316sm | sd127 | 1974 | 1:20000 |
Enet and dempster complex, 2 to 6 percent slopes | EnB | 452 | 453692 | h737 | sd127 | 1974 | 1:20000 |
Enet loam, 0 to 2 percent slopes | BwA | 1747 | 354477 | 2wkrt | sd129 | 1975 | 1:20000 |
Enet loam, 2 to 6 percent slopes | BwB | 901 | 354478 | 2xhdh | sd129 | 1975 | 1:20000 |
Delmont-Enet loams, 0 to 2 percent slopes | EhA | 1341 | 418078 | 2wkr3 | sd135 | 1977 | 1:20000 |
Delmont-Enet loams, 2 to 6 percent slopes | EhB | 944 | 418079 | 2wkr4 | sd135 | 1977 | 1:20000 |
Delmont-Enet loams, high precipitation, 0 to 2 percent slopes | DlA | 16 | 3082509 | 2xhdj | sd135 | 1977 | 1:20000 |
Delmont-Enet loams, high precipitation, 2 to 6 percent slopes | EhhB | 6 | 3082555 | 2xhdk | sd135 | 1977 | 1:20000 |
Enet loam, 0 to 2 percent slopes | EnA | 2706 | 417964 | 2wkrt | sd602 | 1975 | 1:20000 |