| Rock outcrop-Rubble land-Enentah complex, 40 to 200 percent slopes | 34 | 25 | 2407111 | jzzt | co642 | 2012 | 1:24000 |
Enentah, landslide-Sambrito family-Haydenfork family, occasionally flooded complex, 5 to 30 percent slopes | 65 | 11407 | 509373 | k31d | co647 | | 1:24000 |
Enentah, very stony-Slocum family complex, 5 to 30 percent slopes | 41 | 8604 | 509340 | k30b | co647 | | 1:24000 |
Enentah family-Leroux complex, 5 to 30 percent slopes, extremely stony | 54 | 1589 | 509354 | k30s | co647 | | 1:24000 |
Enentah very stony loam, 10 to 40 percent slopes | 6 | 5995 | 506430 | jzzg | co651 | 1999 | 1:24000 |
Enentah-Rubble land complex, 25 to 70 percent slopes | 7 | 1352 | 506429 | jzzf | co651 | 1999 | 1:24000 |
Rock outcrop-Rubble land-Enentah complex, 40 to 200 percent slopes | 34 | 1348 | 506441 | jzzt | co651 | 1999 | 1:24000 |
Enentah family, very bouldery surface-Rubble land-Rock outcrop complex, 15 to 65 percent slopes | 43B7AE | 861 | 3469109 | 2yy4v | id700 | | 1:24000 |
Broad Canyon, very bouldery surface-Enentah, extremely bouldery surface, families, complex, 12 to 60 percent slopes | 43B7AB | 46 | 3469110 | 2yy4z | id700 | | 1:24000 |
Ketchum, very stony surface-Enentah, extremely stony surface families, complex, 35 to 70 percent slopes | 127AW | 70725 | 3175647 | 2z449 | id703 | | 1:24000 |
Broad Canyon, very bouldery surface-Enentah, extremely bouldery surface, families, complex, 12 to 60 percent slopes | 43B7AB | 25536 | 3173423 | 2yy4z | id703 | | 1:24000 |
Enentah, very bouldery surface-Ketchum, rubbly surface, families, complex, 20 to 50 percent slopes | 43B7AH | 19525 | 3173411 | 2yy4l | id703 | | 1:24000 |
Kaina-Lag-Enentah, families, complex, 35 to 80 percent slopes | 127BD | 10967 | 3175644 | 2z446 | id703 | | 1:24000 |
Enentah family, very bouldery surface-Rubble land-Rock outcrop complex, 15 to 65 percent slopes | 43B7AE | 8095 | 3173419 | 2yy4v | id703 | | 1:24000 |
Booneville family-Enentah family-Zeebar complex, 20 to 60 percent slopes | 127AY | 6363 | 3239012 | 2ztdl | id703 | | 1:24000 |
Sweethollow, very bouldery surface-Enentah, extremely bouldery surface, families, complex, 20 to 35 percent slopes | 43B7AF | 3994 | 3173440 | 2yy5h | id703 | | 1:24000 |
Enentah family, extremely stony surface-Leighcan family, extremely bouldery surface-Como family, complex, 10 to 30 percent slopes | 127CA | 2680 | 3239072 | 30mqv | id703 | | 1:24000 |
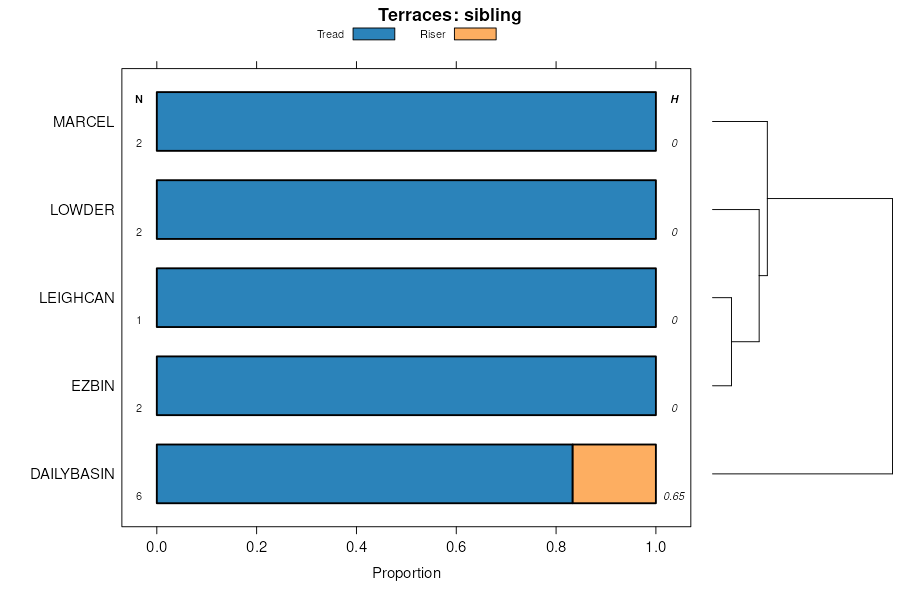
Enentah family, rubbly surface-Dailybasin family-Marcel family, complex, 5 to 40 percent slopes | 127CC | 117172 | 3320432 | 30mqx | id720 | | 1:24000 |
Enentah family, extremely stony surface-Parkay family, very stony surface-Koffgo family, stony surface, complex, 2 to 45 percent slopes | 43B7DE | 86847 | 3377642 | 313v0 | id720 | | 1:24000 |
Enentah family, extremely stony surface-Leighcan family, extremely bouldery surface-Como family, complex, 10 to 30 percent slopes | 127CA | 31289 | 3320430 | 30mqv | id720 | | 1:24000 |
Ezbin family, extremely stony surface-Enentah family, rubbly surface-Charcoal family, very stony surface, complex, 2 to 30 percent slopes | 127CB | 28754 | 3320431 | 30mqw | id720 | | 1:24000 |
Worock-Spearhead-Enentah, families, complex, 15 to 70 percent slopes, extremely stony surface | 127CL | 16871 | 3320441 | 30mqz | id720 | | 1:24000 |
Rhylow family, very stony surface-Vitrandic Haplocryepts, extremely stony surface-Enentah family, very stony surface, complex, 0 to 30 percent slopes | 43B7CW | 11193 | 3377639 | 313tx | id720 | | 1:24000 |
Lag family, moderately deep-Shakespeare family-Enentah family, complex, 20 to 65 percent slopes | 127CR | 8898 | 3320447 | 30mrd | id720 | | 1:24000 |
Ketchum, very stony surface-Enentah, extremely stony surface families, complex, 35 to 70 percent slopes | 127AW | 3816 | 3320465 | 2z449 | id720 | | 1:24000 |
Ezbin family, extremely stony surface-Enentah family, rubbly surface-Ustic Haplocryolls family, very stony surface, complex, 2 to 30 percent slopes | 43B7DU | 960 | 3458636 | 31wlw | id720 | | 1:24000 |
Booneville family-Enentah family-Zeebar complex, 20 to 60 percent slopes | 127AY | 321 | 3320466 | 2ztdl | id720 | | 1:24000 |
Worock-Spearhead-Enentah, families, complex, 15 to 70 percent slopes, extremely stony surface | 127CL | 1533 | 3312445 | 30mqz | id752 | 1999 | 1:24000 |
Ketchum, very stony surface-Enentah, extremely stony surface families, complex, 35 to 70 percent slopes | 127AW | 1428 | 3239066 | 2z449 | id752 | 1999 | 1:24000 |
Enentah family, extremely stony surface-Leighcan family, extremely bouldery surface-Como family, complex, 10 to 30 percent slopes | 127CA | 262 | 3312438 | 30mqv | id752 | 1999 | 1:24000 |
Lag family, moderately deep-Shakespeare family-Enentah family, complex, 20 to 65 percent slopes | 127CR | 192 | 3312450 | 30mrd | id752 | 1999 | 1:24000 |
Enentah family, rubbly surface-Dailybasin family-Marcel family, complex, 5 to 40 percent slopes | 127CC | 146 | 3312439 | 30mqx | id752 | 1999 | 1:24000 |
Ketchum, very stony surface-Enentah, extremely stony surface families, complex, 35 to 70 percent slopes | 127AW | 297 | 3239087 | 2z449 | id763 | 1998 | 1:24000 |
Cundiyo, very stony-Enentah complex, 30 to 60 percent slopes | CN | 660 | 2934460 | 2whjv | nm678 | | 1:24000 |
Enentah-Rock outcrop-Rubble land complex, 35 to 80 percent slopes, very stony | EHG | 317 | 2934587 | 2wl29 | nm678 | | 1:24000 |
Como-Enentah families-Rock outcrop complex, 10 to 35 percent slopes | 310 | 19926 | 157906 | 599r | wy656 | 2008 | 1:24000 |
Rock outcrop-Dystrocryepts-Enentah family complex, 15 to 45 percent slopes | 311 | 16039 | 157907 | 599s | wy656 | 2008 | 1:24000 |
Como-Enentah families, complex, 20 to 35 percent slopes | 321 | 9106 | 157916 | 59b2 | wy656 | 2008 | 1:24000 |
Eutrocryepts-Rubble land-Enentah family complex, 50 to 70 percent slopes | 319 | 7099 | 157914 | 59b0 | wy656 | 2008 | 1:24000 |
Frisco-Enentah families, complex, 5 to 30 percent slopes | 350 | 6393 | 157876 | 598s | wy656 | 2008 | 1:24000 |
Enentah-Buell families-Eutrocryepts complex, 15 to 30 percent slopes | 314 | 4625 | 157909 | 599v | wy656 | 2008 | 1:24000 |
Enentah-Firada families, complex, 15 to 35 percent slopes | 327 | 1776 | 157873 | 598p | wy656 | 2008 | 1:24000 |
Tamarron-Enentah-Badwater families, complex, 40 to 90 percent slopes -- draft | 336 | 23493 | 152012 | 535m | wy663 | 2012 | 1:24000 |
Enentah-Coldfeet families, complex, 40 to 90 percent slopes | 346 | 13671 | 152015 | 535q | wy663 | 2012 | 1:24000 |
Enentah family-Inceptic Haplocryalfs-Rubble land complex, 40 to 90 percent slopes | 325 | 12064 | 152005 | 535d | wy663 | 2012 | 1:24000 |
Enentah-Gralic families, complex, 10 to 40 percent slopes | 333 | 11757 | 152009 | 535j | wy663 | 2012 | 1:24000 |
Telcher-Enentah families, complex, 30 to 60 percent slopes | 335 | 4967 | 152011 | 535l | wy663 | 2012 | 1:24000 |
Como-Enentah-Coldfeet families, complex, 10 to 40 percent slopes | 324 | 1629 | 152004 | 535c | wy663 | 2012 | 1:24000 |
Enentah family-Lithic Cryorthents-Ezbin family, complex, 5 to 40 percent slopes -- draft | 423 | 1595 | 152038 | 536g | wy663 | 2012 | 1:24000 |
Tamarron-Enentah-Badwater families, complex, 40 to 90 percent slopes -- draft | 336 | 2720 | 2611985 | 535m | wy723 | | 1:24000 |
Enentah-Gralic families, complex, 10 to 40 percent slopes | 333 | 1321 | 2925208 | 535j | wy723 | | 1:24000 |
Enentah family-Lithic Cryorthents-Ezbin family, complex, 5 to 40 percent slopes -- draft | 423 | 57 | 2771631 | 536g | wy723 | | 1:24000 |