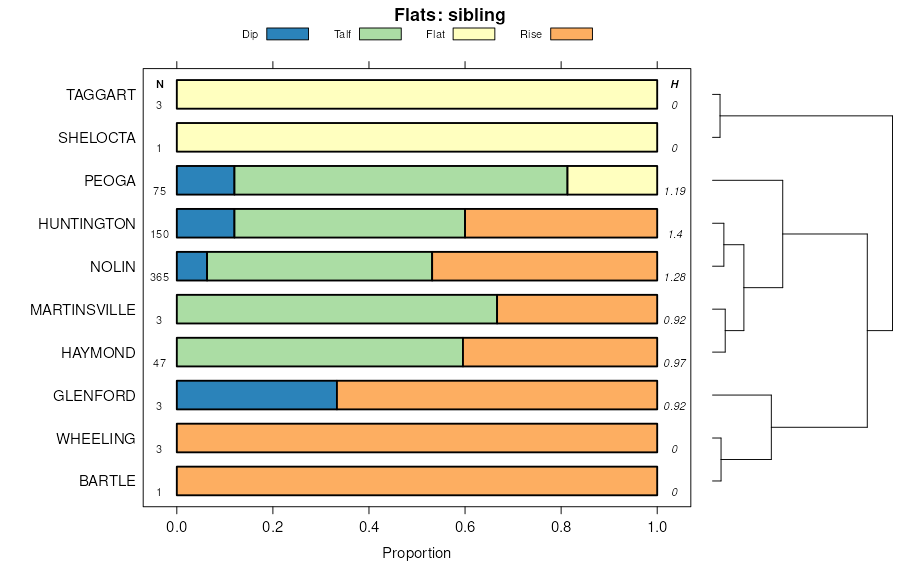
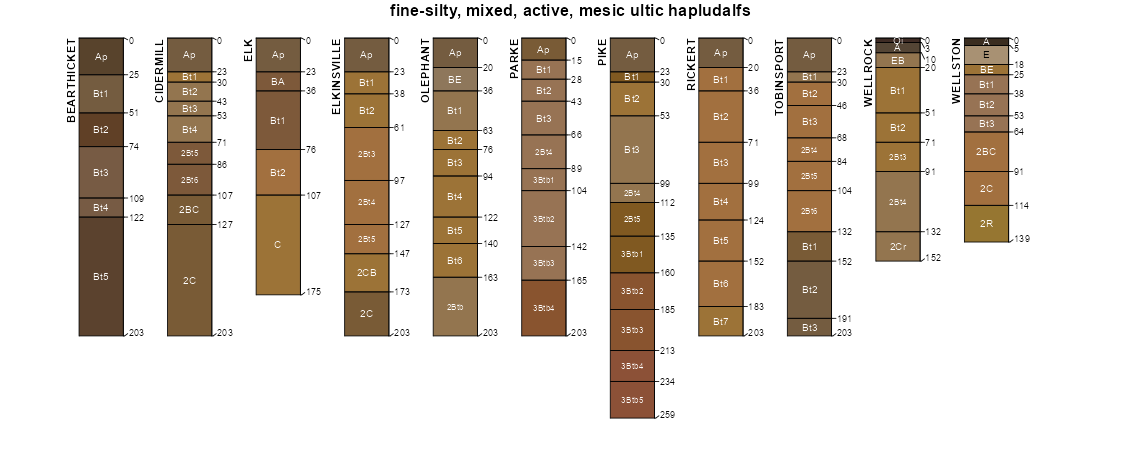
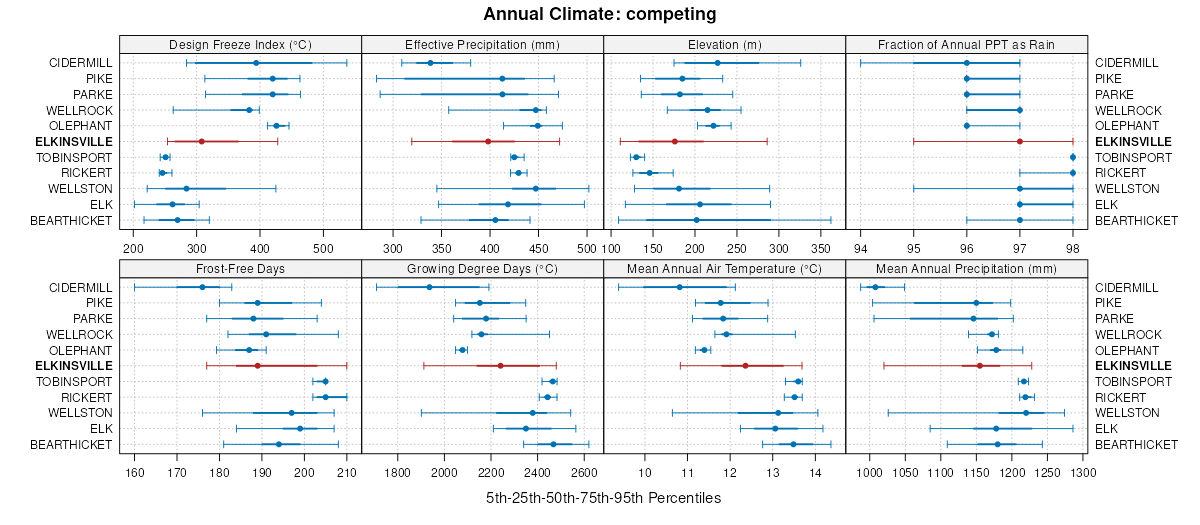
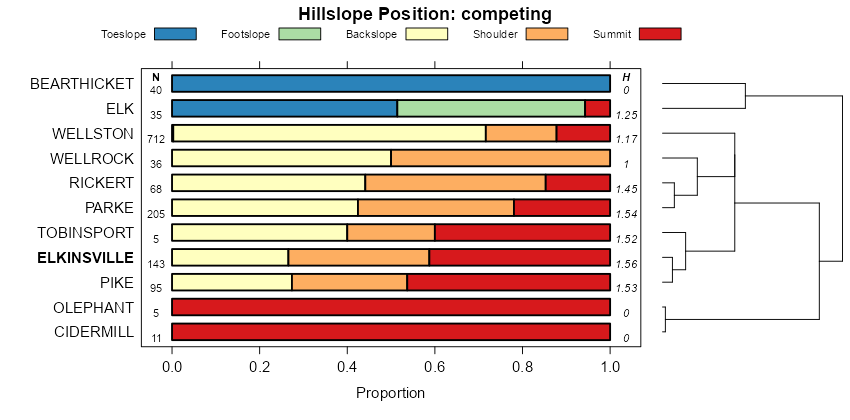
| Elkinsville silt loam, 0 to 2 percent slopes, rarely flooded | EepAQ | 83 | 207268 | 6yp2 | in005 | 2002 | 1:12000 |
Elkinsville-Millstone silt loams, 2 to 6 percent slopes | EesB | 1343 | 201096 | 6r7z | in019 | 2001 | 1:12000 |
Elkinsville-Millstone silt loams, 0 to 2 percent slopes | EesA | 1026 | 201095 | 6r7y | in019 | 2001 | 1:12000 |
Elkinsville-Millstone silt loams, 6 to 12 percent slopes, eroded | EesC2 | 269 | 201099 | 6r82 | in019 | 2001 | 1:12000 |
Elkinsville-Millstone silt loams, 18 to 40 percent slopes, rarely flooded | EesFQ | 209 | 201104 | 6r87 | in019 | 2001 | 1:12000 |
Elkinsville-Millstone silt loams, 12 to 18 percent slopes, eroded | EesD2 | 172 | 201101 | 6r84 | in019 | 2001 | 1:12000 |
Elkinsville silt loam, 2 to 6 percent slopes | EepB | 725 | 1652574 | 2wh48 | in025 | 1970 | 1:20000 |
Elkinsville silt loam, 6 to 12 percent slopes, eroded | EepC2 | 320 | 1652575 | 2wh43 | in025 | 1970 | 1:20000 |
Millstone-Elkinsville complex, 6 to 12 percent slopes, eroded | MsbC2 | 13 | 1652554 | 1sgm6 | in025 | 1970 | 1:20000 |
Elkinsville silt loam, 6 to 12 percent slopes, eroded | EkC2 | 221 | 1600657 | 1qqm3 | in029 | 1979 | 1:15840 |
Elkinsville silt loam, 0 to 2 percent slopes, rarely flooded | EkA | 218 | 1600655 | 2wlth | in029 | 1979 | 1:15840 |
Elkinsville silt loam, 2 to 6 percent slopes, eroded | EkB2 | 213 | 1600656 | 1qqm2 | in029 | 1979 | 1:15840 |
Elkinsville silt loam, 2 to 6 percent slopes | EepB | 232 | 185163 | 2wh48 | in043 | 2000 | 1:12000 |
Elkinsville silt loam, 25 to 60 percent slopes, rarely flooded | EepGQ | 84 | 185167 | 66p4 | in043 | 2000 | 1:12000 |
Elkinsville silt loam, 0 to 2 percent slopes | EkA | 1934 | 160116 | 5cm1 | in051 | 1986 | 1:15840 |
Elkinsville silt loam, 2 to 6 percent slopes | EkB | 346 | 160117 | 5cm2 | in051 | 1986 | 1:15840 |
Elkinsville silt loam, 2 to 6 percent slopes, eroded | EepB2 | 1086 | 798171 | vskg | in061 | 2007 | 1:12000 |
Elkinsville-Millstone complex, 18 to 40 percent slopes, rarely flooded | EesFQ | 681 | 1677525 | 1t9lq | in061 | 2007 | 1:12000 |
Elkinsville-Millstone complex, 2 to 6 percent slopes | EesB | 480 | 1677520 | 1t9lk | in061 | 2007 | 1:12000 |
Elkinsville silt loam, 6 to 12 percent slopes, eroded | EepC2 | 471 | 1676488 | 2wh43 | in061 | 2007 | 1:12000 |
Elkinsville-Millstone complex, 6 to 12 percent slopes, eroded | EesC2 | 455 | 1677521 | 1t9ll | in061 | 2007 | 1:12000 |
Urban land-Elkinsville-Haymond complex, 0 to 6 percent slopes, rarely flooded | UekAQ | 356 | 1686616 | 1tm1z | in061 | 2007 | 1:12000 |
Elkinsville silt loam, 0 to 2 percent slopes | EepA | 279 | 1676487 | 2wltj | in061 | 2007 | 1:12000 |
Elkinsville-Millstone complex, 0 to 2 percent slopes | EesA | 214 | 1677519 | 1t9lj | in061 | 2007 | 1:12000 |
Elkinsville silt loam, 25 to 60 percent slopes, rarely flooded | EepGQ | 1 | 2108710 | 28s8x | in061 | 2007 | 1:12000 |
Elkinsville silt loam, 2 to 8 percent slopes, rarely flooded | EkB | 1873 | 964649 | 11csq | in077 | 1982 | 1:15840 |
Elkinsville silt loam, 0 to 2 percent slopes, rarely flooded | EkA | 748 | 964648 | 2wlth | in077 | 1982 | 1:15840 |
Elkinsville-Millstone complex, 2 to 6 percent slopes, eroded | EesB2 | 990 | 1651387 | 1sfdk | in079 | 2010 | 1:12000 |
Elkinsville silt loam, 0 to 2 percent slopes, rarely flooded | EepAQ | 50 | 2427934 | 2mhgg | in079 | 2010 | 1:12000 |
Elkinsville silt loam, 0 to 2 percent slopes | EkA | 3122 | 164474 | 5j4m | in083 | 1979 | 1:15840 |
Elkinsville variant loam, 2 to 6 percent slopes, eroded | EhrB2 | 829 | 1651536 | 1sfkc | in093 | 1982 | 1:15840 |
Elkinsville silt loam, 2 to 6 percent slopes | EepB | 573 | 1708129 | 2wh48 | in101 | 1984 | 1:15840 |
Elkinsville silt loam, upland, 20 to 40 percent slopes | EkF | 2984 | 535535 | kz8b | in105 | 1979 | 1:15840 |
Elkinsville silt loam, 2 to 6 percent slopes | EkB | 744 | 535534 | 2wh48 | in105 | 1979 | 1:15840 |
Elkinsville silt loam, 6 to 12 percent slopes, eroded | EsC2 | 463 | 163207 | 5gtr | in109 | 1979 | 1:15840 |
Elkinsville silt loam, 6 to 12 percent slopes, eroded | EkC2 | 154 | 1600549 | 1qqhm | in115 | 1979 | 1:15840 |
Elkinsville silt loam, 0 to 2 percent slopes, rarely flooded | EkA | 101 | 1600547 | 2wlth | in115 | 1979 | 1:15840 |
Elkinsville silt loam, 2 to 6 percent slopes, eroded | EkB2 | 89 | 1600548 | 1qqhl | in115 | 1979 | 1:15840 |
Elkinsville silt loam, 2 to 6 percent slopes | EepB | 1746 | 1442981 | 2wh48 | in117 | 1980 | 1:15840 |
Elkinsville silt loam, 6 to 12 percent slopes, eroded | EepC2 | 684 | 1442982 | 2wh43 | in117 | 1980 | 1:15840 |
Elkinsville silt loam, 0 to 2 percent slopes | EepA | 444 | 1442979 | 2wltj | in117 | 1980 | 1:15840 |
Urban land-Elkinsville-Hatfield complex, 0 to 6 percent slopes | UehB | 785 | 535923 | kznv | in123 | 1997 | 1:12000 |
Millstone-Elkinsville complex, 2 to 6 percent slopes | MsbB | 487 | 535835 | kzl0 | in123 | 1997 | 1:12000 |
Millstone-Elkinsville complex, 2 to 6 percent slopes, rarely flooded | MsbBQ | 418 | 535991 | kzr1 | in123 | 1997 | 1:12000 |
Elkinsville-Millstone complex, 18 to 40 percent slopes, rarely flooded | EesFQ | 290 | 535742 | kzh0 | in123 | 1997 | 1:12000 |
Millstone-Elkinsville complex, 6 to 12 percent slopes, eroded, rarely flooded | MsbCQ | 288 | 535990 | kzr0 | in123 | 1997 | 1:12000 |
Elkinsville-Millstone complex, 0 to 2 percent slopes | EesA | 244 | 535740 | kzgy | in123 | 1997 | 1:12000 |
Millstone-Elkinsville complex, 6 to 12 percent slopes, eroded | MsbC2 | 206 | 535836 | kzl1 | in123 | 1997 | 1:12000 |
Elkinsville-Millstone complex, 0 to 2 percent slopes, rarely flooded | EesAQ | 177 | 535994 | kzr4 | in123 | 1997 | 1:12000 |
Elkinsville-Millstone complex, 12 to 18 percent slopes, eroded, rarely flooded | EesDQ | 164 | 535993 | kzr3 | in123 | 1997 | 1:12000 |
Elkinsville-Millstone complex, 12 to 18 percent slopes, eroded | EesD2 | 58 | 535741 | kzgz | in123 | 1997 | 1:12000 |
Elkinsville silt loam, 0 to 2 percent slopes | EkA | 572 | 161901 | 5fgm | in125 | 1983 | 1:15840 |
Elkinsville silt loam, 0 to 2 percent slopes, rarely flooded | EkA | 6907 | 159882 | 5cch | in129 | 1978 | 1:15840 |
Elkinsville silt loam, 2 to 6 percent slopes, eroded, rarely flooded | EkB2 | 1876 | 159883 | 5ccj | in129 | 1978 | 1:15840 |
Elkinsville silt loam, 2 to 6 percent slopes | ElB | 267 | 159827 | 5c9q | in133 | 1979 | 1:15840 |
Elkinsville silt loam, 2 to 6 percent slopes | EkB | 1002 | 1479631 | 2wh4b | in137 | 1982 | 1:15840 |
Elkinsville silt loam, 6 to 12 percent slopes, eroded | EkC2 | 485 | 1479632 | 1lnp2 | in137 | 1982 | 1:15840 |
Elkinsville silt loam, 18 to 35 percent slopes | EepF | 194 | 165661 | 5kcx | in143 | 1995 | 1:12000 |
Elkinsville silt loam, 2 to 6 percent slopes | EepB | 83 | 165660 | 2wh48 | in143 | 1995 | 1:12000 |
Elkinsville silt loam, 0 to 2 percent slopes | EepA | 35 | 165659 | 5kcv | in143 | 1995 | 1:12000 |
Elkinsville silt loam, rarely flooded, 0 to 2 percent slopes | EkA | 786 | 535277 | kz00 | in155 | 1984 | 1:15840 |
Elkinsville silt loam, rarely flooded, 2 to 8 percent slopes | EkB | 438 | 535278 | kz01 | in155 | 1984 | 1:15840 |
Elkinsville silt loam, 2 to 6 percent slopes | ElB | 484 | 535480 | 2wh48 | in175 | 1984 | 1:15840 |
Elkinsville silt loam, 6 to 12 percent slopes, eroded | ElC2 | 244 | 535481 | 2wh43 | in175 | 1984 | 1:15840 |
Elkinsville silt loam, 1 to 6 percent slopes | EkB | 4642 | 170083 | 5pzk | oh001 | 1987 | 1:15840 |
Elkinsville silt loam, 2 to 6 percent slopes | EnB | 86 | 1895877 | 21mtb | oh001 | 1987 | 1:15840 |
Elkinsville silt loam, 8 to 15 percent slopes | ElC | 833 | 537085 | 2zj1h | oh013 | 1978 | 1:15840 |
Elkinsville silt loam, 3 to 8 percent slopes | ElB | 526 | 537084 | 2zj1g | oh013 | 1978 | 1:15840 |
Elkinsville silt loam, 15 to 25 percent slopes | ElD | 471 | 537086 | 2zj1c | oh013 | 1978 | 1:15840 |
Elkinsville silt loam, 2 to 6 percent slopes | EkB | 1802 | 169718 | 5pls | oh015 | 1987 | 1:15840 |
Elkinsville silt loam, 6 to 12 percent slopes, eroded | EkC2 | 433 | 169719 | 5plt | oh015 | 1987 | 1:15840 |
Elkinsville silt loam, 0 to 3 percent slopes, rarely flooded | Ek | 419 | 537980 | 2zj1m | oh019 | 1981 | 1:15840 |
Elkinsville silt loam, 2 to 6 percent slopes | EkB | 21 | 2440341 | 2mxcp | oh025 | 1972 | 1:20000 |
Elkinsville silt loam, 1 to 6 percent slopes | EkB | 2129 | 536802 | 2zj19 | oh053 | 1988 | 1:15840 |
Urban land-Alfic Udarents-Elkinsville complex, 0 to 12 percent slopes | UAKXC | 736 | 2652879 | 2pyz8 | oh061 | 1980 | 1:15840 |
Elkinsville silt loam, 6 to 12 percent slopes | EvC | 67 | 2652846 | 2q6yv | oh061 | 1980 | 1:15840 |
Elkinsville silt loam, 2 to 6 percent slopes | EvB | 55 | 2652845 | 2wh4b | oh061 | 1980 | 1:15840 |
Elkinsville-Urban land complex, 2 to 6 percent slopes | EvUB | 23 | 3404817 | 31gg6 | oh061 | 1980 | 1:15840 |
Elkinsville silt loam, 1 to 6 percent slopes | EkB | 14 | 1420663 | 1jp9v | oh071 | 1973 | 1:15840 |
Elkinsville-Urban land complex, 1 to 8 percent slopes | EmB | 3701 | 536144 | kzwz | oh087 | 1989 | 1:15840 |
Elkinsville silt loam, 1 to 6 percent slopes | EkB | 3182 | 536142 | 2zj19 | oh087 | 1989 | 1:15840 |
Elkinsville silt loam, 15 to 40 percent slopes | EkE | 364 | 536143 | 2zj1d | oh087 | 1989 | 1:15840 |
Elkinsville silt loam, 0 to 2 percent slopes | EkA | 261 | 537154 | 2zj16 | oh105 | 1991 | 1:15840 |
Elkinsville silt loam, 0 to 2 percent slopes, rarely flooded | En | 2182 | 537625 | 2zj1n | oh131 | 1984 | 1:15840 |
Elkinsville silt loam, 1 to 8 percent slopes | EkB | 2768 | 537241 | 2zj1b | oh145 | 1984 | 1:15840 |
Elkinsville silt loam, 25 to 40 percent slopes | EkE | 1679 | 537242 | 2zj1f | oh145 | 1984 | 1:15840 |
Elkinsville-Urban land complex, 1 to 8 percent slopes | EmB | 1541 | 537243 | l11f | oh145 | 1984 | 1:15840 |
Elkinsville silt loam, 1 to 6 percent slopes | EhB | 12 | 1460808 | 2zj19 | oh145 | 1984 | 1:15840 |
Elkinsville silt loam, 0 to 3 percent slopes | EkA | 600 | 536303 | 2zj18 | oh157 | 1981 | 1:15840 |