Official Series Description


Lab Data Summary

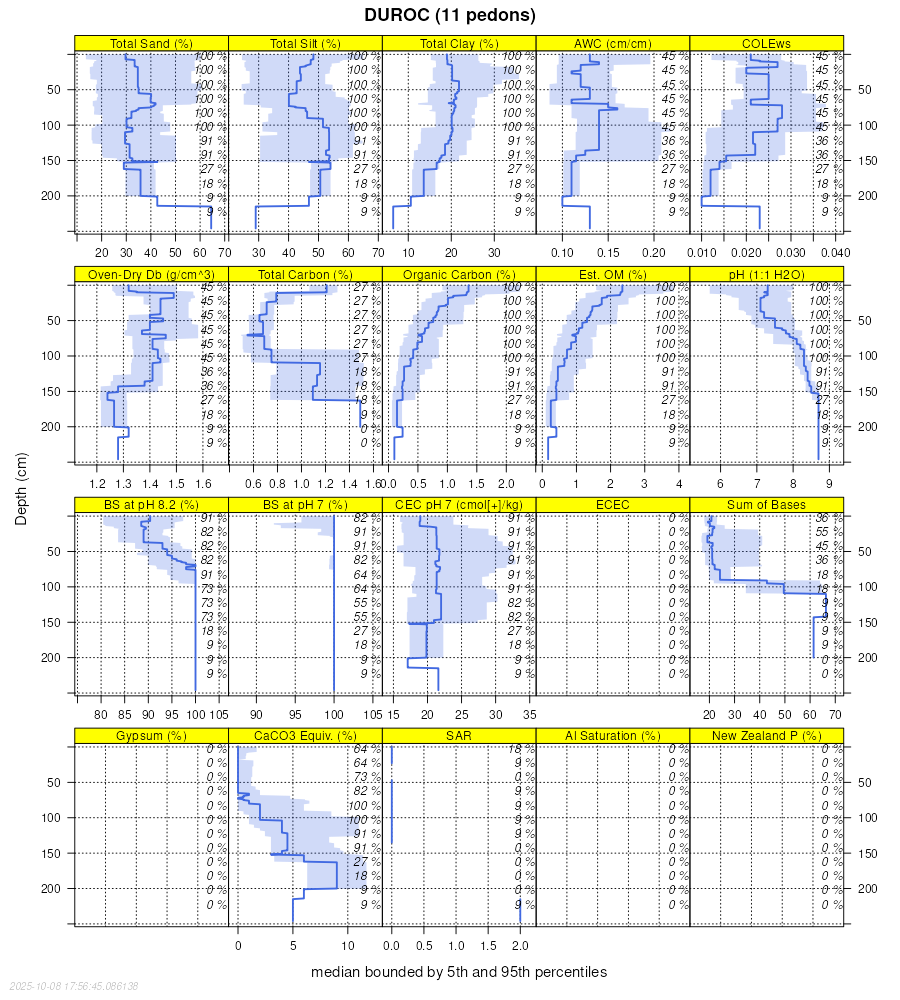
Aggregate lab data for the DUROC soil series. This aggregation is based on all pedons with a current taxon name of DUROC, and applied along 1-cm thick depth slices. Solid lines are the slice-wise median, bounded on either side by the interval defined by the slice-wise 5th and 95th percentiles. The median is the value that splits the data in half. Five percent of the data are less than the 5th percentile, and five percent of the data are greater than the 95th percentile. Values along the right hand side y-axis describe the proportion of pedon data that contribute to aggregate values at this depth. For example, a value of "90%" at 25cm means that 90% of the pedons correlated to DUROC were used in the calculation. Source: KSSL snapshot . Methods used to assemble the KSSL snapshot used by SoilWeb / SDE

Click the image to view it full size.

Pedons used in the lab summary:

MLRALab IDPedon IDTaxonnameCINSSL / NASIS ReportsLink To SoilWeb GMap
6440A2468S1957SD113011DUROC7Primary | Supplementary | Taxonomy | Pedon | Water Retention | Correlation | Andic Soil Properties43.0716667,-102.5780563
6440A2493S1958SD095004Duroc5Primary | Supplementary | Taxonomy | Pedon | Water Retention | Correlation | Andic Soil Properties43.4647217,-101.1219406
6440A2497S1958SD095009Duroc7Primary | Supplementary | Taxonomy | Pedon | Water Retention | Correlation | Andic Soil Properties43.4283333,-101.2177811
6480P0105S1979NE013038Duroc7Primary | Supplementary | Taxonomy | Pedon | Water Retention | Correlation | Andic Soil Properties42.190444,-102.882694
67A07N0089S2006NE157115Duroc7Primary | Supplementary | Taxonomy | Pedon | Water Retention | Correlation | Andic Soil Properties41.8138657,-103.9494858
7289P013488NE057002Duroc6Primary | Supplementary | Taxonomy | Pedon | Water Retention | Correlation | Andic Soil Properties40.3241653,-101.3830566
7289P013588NE057003Duroc6Primary | Supplementary | Taxonomy | Pedon | Water Retention | Correlation | Andic Soil Properties40.3241653,-101.3830566
7283P0433S1981NE007007DUROC5Primary | Supplementary | Taxonomy | Pedon | Water Retention | Correlation | Andic Soil Properties41.4297218,-103.8119431
7284P0744S1984NE101025Duroc7Primary | Supplementary | Taxonomy | Pedon | Water Retention | Correlation | Andic Soil Properties41.189167,-101.8627777
7285P0845S1985NE033052Duroc8Primary | Supplementary | Taxonomy | Pedon | Water Retention | Correlation | Andic Soil Properties41.3647232,-102.8952789
n/a02N0414S2001CO075005Duroc7Primary | Supplementary | Taxonomy | Pedon | Water Retention | Correlation | Andic Soil Propertiesn/a

Water Balance

Monthly water balance estimated using a leaky-bucket style model for the DUROC soil series. Monthly precipitation (PPT) and potential evapotranspiration (PET) have been estimated from the 50th percentile of gridded values (PRISM 1981-2010) overlapping with the extent of SSURGO map units containing each series as a major component. Monthly PET values were estimated using the method of Thornthwaite (1948). These (and other) climatic parameters are calculated with each SSURGO refresh and provided by the fetchOSD function of the soilDB package. Representative water storage values (“AWC” in the figures) were derived from SSURGO by taking the 50th percentile of profile-total water storage (sum[awc_r * horizon thickness]) for each soil series. Note that this representation of “water storage” is based on the average ability of most plants to extract soil water between 15 bar (“permanent wilting point”) and 1/3 bar (“field capacity”) matric potential. Soil moisture state can be roughly interpreted as “dry” when storage is depleted, “moist” when storage is between 0mm and AWC, and “wet” when there is a surplus. Clearly there are a lot of assumptions baked into this kind of monthly water balance. This is still a work in progress.

Click the image to view it full size.


Click the image to view it full size.

Sibling Summary

Siblings are those soil series that occur together in map units, in this case with the DUROC series. Sketches are arranged according to their subgroup-level taxonomic structure. Source: SSURGO snapshot , parsed OSD records and snapshot of SC database .

Click the image to view it full size.

Select annual climate data summaries for the DUROC series and siblings. Series are sorted according to hierarchical clustering of median values. Source: SSURGO map unit geometry and 1981-2010, 800m PRISM data .

Click the image to view it full size.

Geomorphic description summaries for the DUROC series and siblings. Series are sorted according to hierarchical clustering of proportions and relative hydrologic position within an idealized landform (e.g. top to bottom). Most soil series (SSURGO components) are associated with a hillslope position and one or more landform-specific positions: hills, mountain slopes, terraces, and/or flats. Proportions can be interpreted as an aggregate representation of geomorphic membership. The values printed to the left (number of component records) and right (Shannon entropy) of stacked bars can be used to judge the reliability of trends. Small Shannon entropy values suggest relatively consistent geomorphic association, while larger values suggest lack thereof. Source: SSURGO component records .

Click the image to view it full size.

Click the image to view it full size.

There are insufficient data to create the 3D mountains figure.

Click the image to view it full size.

Click the image to view it full size.

Competing Series

Soil series competing with DUROC share the same family level classification in Soil Taxonomy. Source: parsed OSD records and snapshot of the SC database .

Click the image to view it full size.

Select annual climate data summaries for the DUROC series and competing. Series are sorted according to hierarchical clustering of median values. Source: SSURGO map unit geometry and 1981-2010, 800m PRISM data .

Click the image to view it full size.

Geomorphic description summaries for the DUROC series and competing. Series are sorted according to hierarchical clustering of proportions and relative hydrologic position within an idealized landform (e.g. top to bottom). Proportions can be interpreted as an aggregate representation of geomorphic membership. Most soil series (SSURGO components) are associated with a hillslope position and one or more landform-specific positions: hills, mountain slopes, terraces, and/or flats. The values printed to the left (number of component records) and right (Shannon entropy) of stacked bars can be used to judge the reliability of trends. Shannon entropy values close to 0 represent soil series with relatively consistent geomorphic association, while values close to 1 suggest lack thereof. Source: SSURGO component records .

Click the image to view it full size.

Click the image to view it full size.

There are insufficient data to create the 3D mountains figure.

Click the image to view it full size.

Click the image to view it full size.

Soil series sharing subgroup-level classification with DUROC, arranged according to family differentiae. Hovering over a series name will print full classification and a small sketch from the OSD. Source: snapshot of SC database .

Block Diagrams

Click a link below to display the diagram. Note that these diagrams may be from multiple survey areas.

  1. NE-2010-09-09-02 | Garden County - 1999

    Typical pattern of the soils and underlying material in the Alliance-Sidney-Duroc association (Soil Survey of Garden County, Nebraska; 1999).

  2. NE-2010-09-09-05 | Garden County - 1999

    Typical pattern of the soils and underlying material in the Keith-Kuma-Duroc association (Soil Survey of Garden County, Nebraska; 1999).

  3. NE-2010-09-28-02 | Dundy County -

    Typical pattern of soil and underlying material in the Blackwood-Ulysses association (Soil Survey of Dundy County, Nebraska).

  4. NE-2012-02-08-01 | Banner County - October 1994

    Typical pattern of soils and parent material in the Alliance-Keith-Sidney association (Soil Survey of Banner County, Nebraska; October 1994).

  5. NE-2012-02-13-06 | Garden County - 1999

    Typical pattern of the soils and underlying material in the Alliance-Sidney-Duroc association (Soil Survey of Garden County, Nebraska; 1999).

  6. NE-2012-02-13-26 | Hayes County - August 1982

    The relationship of soils to topography and parent material in the Bridget-McCook-Gibbon association (Soil Survey of Hayes County, Nebraska; August 1982).

  7. NE-2012-02-13-43 | Keith County - November 1995

    Typical pattern of soils and parent material in the Satanta-Kuma association (Soil Survey of Keith County, Nebraska; November 1995).

  8. NE-2012-02-13-44 | Keith County - November 1995

    Typical pattern of soils and parent material in the Bayard-Duroc-Bridget association (Soil Survey of Keith County, Nebraska; November 1995).

  9. NE-2012-02-13-58 | Morrill County - August 1985

    Pattern of soils, topography, and underlying material in the Tripp-Alice-Duroc association (Soil Survey of Morrill County, Nebraska; August 1985).

  10. NE-2012-02-13-60 | Morrill County - August 1985

    A generalized cross section of Morrill County that shows the relationship of parent material, soil associations, and elevation (Soil Survey of Morrill County, Nebraska; August 1985).

  11. NE-2012-02-13-94 | Sheridan County - 2002

    Typical pattern of soils and parent material in the Oglala-Alliance-Canyon association (Soil Survey of Sheridan County, Nebraska; 2002).

Map Units

Map units containing DUROC as a major component. Limited to 250 records.

Map Unit Name Symbol Map Unit Area (ac) Map Unit Key National Map Unit Symbol Soil Survey Area Publication Date Map Scale
Duroc loam, 1 to 3 percent slopes5943731916924781tt52ne00719881:20000
Duroc loam, 0 to 1 percent slopes5942161816924772tv63ne00719881:20000
Duroc loam, occasionally flooded562515118357786d09hne01319801:20000
Duroc loam, 1 to 3 percent slopes5943141183577852tzzwne01319801:20000
Duroc loam, 0 to 1 percent slopes59421622195122tv63ne02919801:20000
Duroc loam, 0 to 1 percent slopes59426424816986772tv63ne03319891:20000
Duroc loam, 1 to 3 percent slopes59431443416986781v0m2ne03319891:20000
Duroc silt loam, terrace, 0 to 1 percent slopes5626775416986801v0m4ne03319891:20000
Duroc loam, terrace, gravelly substratum, 0 to 1 percent slopes582469116986791v0m3ne03319891:20000
Duroc very fine sandy loam, 1 to 3 percent slopes5947690335809930wp0ne04519731:20000
Duroc loam, 1 to 3 percent slopes594318822175652tzzwne04519731:20000
Duroc loam, 0 to 1 percent slopes59421073616988012tv63ne04920001:24000
Duroc loam, terrace, 0 to 1 percent slopes5822523416988021v0r2ne04920001:24000
Duroc loam, terrace, 1 to 3 percent slopes582379916988031v0r3ne04920001:24000
Duroc silt loam, 1 to 3 percent slopes5946522195612dhmrne04920001:24000
Duroc loam, 0 to 1 percent slopes5942195916990892tv63ne05719951:24000
Duroc loam, 0 to 1 percent slopes59421461716987382tv63ne06919951:20000
Duroc silt loam, 0 to 1 percent slopes5945118816992401v166ne08519811:20000
Duroc silt loam, 1 to 3 percent slopes5946106916992411v167ne08519811:20000
Duroc silt loam, terrace, 0 to 1 percent slopes5626312216992711v176ne08719651:20000
Duroc silt loam, terrace, 1 to 3 percent slopes562725616992721v177ne08719651:20000
Duroc silt loam, 1 to 3 percent slopes59461920516988861v0tsne10119901:20000
Duroc loam, terrace, 0 to 1 percent slopes5822966916988831v0tpne10119901:20000
Duroc silt loam, 0 to 1 percent slopes5945385416988851v0trne10119901:20000
Duroc loam, terrace, 1 to 3 percent slopes5823199016988841v0tqne10119901:20000
Duroc loam, 0 to 1 percent slopes5942922195862tv63ne10119901:20000
Duroc loam, 0 to 1 percent slopes5942522279322tv63ne10520041:24000
Duroc silt loam, 1 to 3 percent slopes594641622197252dht1ne11119711:24000
Duroc loam, terrace, 0 to 1 percent slopes58224222197242dht0ne11119711:24000
Duroc loam, 1 to 3 percent slopes5943766216926051tt95ne12319811:20000
Duroc loam, 0 to 1 percent slopes5942619616926042tv63ne12319811:20000
Duroc loam, 3 to 6 percent slopes5948102216926061tt96ne12319811:20000
Duroc loam, 1 to 6 percent slopes5944822203912djhjne12319811:20000
Duroc silt loam, terrace, 0 to 1 percent slopes5626112622190742dh41ne14519651:20000
Duroc loam, 1 to 6 percent slopes5944140616537341shv8ne15719651:20000
Duroc loam, 1 to 3 percent slopes594335701005812tzzwne16119921:20000
Duroc loam, 0 to 1 percent slopes594231241005803cnjne16119921:20000
Duroc very fine sandy loam, 1 to 3 percent slopes594712221985430wp0ne16119921:20000
Duroc and Kadoka silt loams, 2 to 5 percent slopesDvB2950353361cvprsd09519711:20000
Duroc and Kadoka silt loams, 0 to 2 percent slopesDvA1268353360cvpqsd09519711:20000
Duroc loam, 0 to 1 percent slopesDuA19631046933hy6wy61519651:20000
Duroc loam, 1 to 3 percent slopesDuB9741046903hy3wy61519651:20000

Map of Series Extent

Approximate geographic distribution of the DUROC soil series. To learn more about how this distribution was mapped, or to compare this soil series extent to others, use the Series Extent Explorer (SEE) application. Source: generalization of SSURGO geometry .