| Dranyon loam, 3 to 20 percent slopes | 59 | 2855 | 497236 | jpdw | co686 | 1992 | 1:31680 |
Greys-Dranyon complex, 12 to 30 percent slopes | 43B728 | 1348 | 2428285 | 2mhts | id650 | 2011 | 1:24000 |
Dranyon-Dra complex, 12 to 45 percent slopes | 43B721 | 860 | 2408048 | 2ltrz | id650 | 2011 | 1:24000 |
Dranyon silt loam, 2 to 25 percent slopes | 43B725 | 701 | 2428250 | 2mhsn | id650 | 2011 | 1:24000 |
Greys-Dranyon complex, 2 to 12 percent slopes | 43B730 | 477 | 2428343 | 2mhwn | id650 | 2011 | 1:24000 |
Kucera-Dranyon-Tetonia complex, 2 to 15 percent slopes | 13463 | 429 | 2427842 | 2mhch | id650 | 2011 | 1:24000 |
Dranyon-Dehana gravelly loams, 2 to 40 percent slopes | 52 | 715 | 486214 | j9yb | id675 | 1992 | 1:24000 |
Dranyon-Ricrest association, steep | 17 | 1877 | 82590 | 2ry6 | id709 | 1976 | 1:24000 |
Manila-Dranyon association, hilly | 34 | 1554 | 82609 | 2ryt | id709 | 1976 | 1:24000 |
Moohoo-Dranyon association, steep | MHG | 6037 | 82744 | 2s35 | id710 | 1968 | 1:24000 |
Dranyon silt loam, rolling | DRF | 3412 | 82709 | 2s21 | id710 | 1968 | 1:24000 |
Moohoo-Dranyon association, hilly | MHF | 1335 | 82743 | 2s34 | id710 | 1968 | 1:24000 |
Dranyon-Hades-Hagenbarth complex, 10 to 35 percent slopes | 3200 | 515 | 3238954 | 2pt1s | id710 | 1968 | 1:24000 |
Yago, very bouldery surface-Dranyon-Beaverdam complex, 5 to 30 percent slopes | 2260 | 142 | 2558444 | 2pcyn | id710 | 1968 | 1:24000 |
Camelback, very deep-Dranyon-Beehunt complex, 8 to 35 percent slopes | 2011 | 9 | 3238951 | 2x3mx | id710 | 1968 | 1:24000 |
Pavohroo-Dranyon association, 10 to 30 percent slopes | PDE | 190 | 3238966 | n4c9 | id711 | 1983 | 1:24000 |
Yago, very bouldery surface-Dranyon-Beaverdam complex, 5 to 30 percent slopes | 2260 | 55 | 2558434 | 2pcyn | id711 | 1983 | 1:24000 |
Dranyon-Hades-Hagenbarth complex, 10 to 35 percent slopes | 3200 | 27 | 3238974 | 2pt1s | id711 | 1983 | 1:24000 |
Lag-Dranyon complex, 10 to 60 percent slopes | 126 | 1243 | 3163503 | 2wd4w | id712 | 2008 | 1:24000 |
Dranyon silt loam, 10 to 40 percent slopes | 79 | 1037 | 3163498 | 2wd4x | id712 | 2008 | 1:24000 |
Chokecherry-Dranyon complex, 15 to 60 percent slopes | 52 | 333 | 154509 | 55s5 | id712 | 2008 | 1:24000 |
Winnemucca, bouldery surface-Dranyon-Bailcreek family, extremely bouldery surface, complex, 10 to 30 percent slopes | 1046a | 208 | 3173296 | 2wzzy | id712 | 2008 | 1:24000 |
Ezbin-Cluff family, bouldery surface-Dranyon complex, 8 to 25 percent slopes | 1060 | 31 | 3173298 | 2x008 | id712 | 2008 | 1:24000 |
Hondoho, very stony surface-Clegg-Dranyon complex, 25 to 60 percent slopes | 1035 | 29 | 3173293 | 2w9rt | id712 | 2008 | 1:24000 |
Booneville-Dranyon-Zeebar family, very stony surface, complex, 15 to 40 percent slopes | 1058 | 21 | 3173297 | 2x006 | id712 | 2008 | 1:24000 |
Ezbin-Cluff family, bouldery surface-Dranyon complex, 8 to 25 percent slopes | 1060 | 4485 | 2980846 | 2x008 | id713 | | 1:24000 |
Winnemucca, bouldery surface-Dranyon-Bailcreek family, extremely bouldery surface, complex, 10 to 30 percent slopes | 1046a | 3639 | 2980836 | 2wzzy | id713 | | 1:24000 |
Booneville-Dranyon-Zeebar family, very stony surface, complex, 15 to 40 percent slopes | 1058 | 2820 | 2980844 | 2x006 | id713 | | 1:24000 |
Ireland-Hondoho-Dranyon complex, 15 to 50 percent slopes | 2550 | 1706 | 2520248 | 2pt1n | id713 | | 1:24000 |
Booneville-Farlow family, very stony surface-Dranyon complex, 25 to 50 percent slopes | 1058a | 1646 | 2980845 | 2x007 | id713 | | 1:24000 |
Yago, very bouldery surface-Dranyon-Beaverdam complex, 5 to 30 percent slopes | 2260 | 1620 | 2514597 | 2pcyn | id713 | | 1:24000 |
Kingmine family-Dranyon-Starley family, complex, 45 to 75 percent slopes | 986 | 1172 | 2963887 | 2wv3g | id713 | | 1:24000 |
Dranburn-Winnemucca-Booneville, complex, 15 to 35 percent slopes, MLRA 43B | 861 | 866 | 2984242 | 2x03n | id713 | | 1:24000 |
Dranyon-Goodski family, complex, 25 to 55 percent slopes | 894 | 694 | 2963865 | 2wv2q | id713 | | 1:24000 |
Hondoho, very stony surface-Clegg-Dranyon complex, 25 to 60 percent slopes | 1035 | 687 | 2917036 | 2w9rt | id713 | | 1:24000 |
Pavohroo-Lund-Dranyon complex, 12 to 40 percent slopes | 7032 | 517 | 2981066 | 2yvfc | id713 | | 1:24000 |
Lag-Dranyon complex, 10 to 60 percent slopes | 126 | 369 | 2917047 | 2wd4w | id713 | | 1:24000 |
Ireland-Dranyon-Hagenbarth complex, 20 to 50 percent slopes | 7080 | 338 | 3093885 | 2xxdq | id713 | | 1:24000 |
Dranburn-Dranyon-Calpac complex, 15 to 50 percent slopes | 7060 | 176 | 3093884 | 2xxdm | id713 | | 1:24000 |
Dranyon-Booneville-Hagenbarth complex, 5 to 30 percent slopes | 7005 | 169 | 2981067 | 2xxdj | id713 | | 1:24000 |
Dranyon silt loam, 10 to 40 percent slopes | 79-BL | 90 | 2917048 | 2wd4x | id713 | | 1:24000 |
Chokecherry-Dranyon complex, 15 to 60 percent slopes | 52 | 87 | 3093896 | 55s5 | id713 | | 1:24000 |
Clegg-Drage-Dranyon complex, 12 to 50 percent slopes | 7085 | 74 | 2981073 | 2xxdr | id713 | | 1:24000 |
Booneville-Dranyon-Ireland complex, 20 to 55 percent slopes | 7010 | 31 | 2980919 | 2xxdk | id713 | | 1:24000 |
Chippy-Dranyon complex, 5 to 35 percent slopes | 7070 | 15 | 2980918 | 2xxds | id713 | | 1:24000 |
Hagenbarth-Dranyon-Crystalbutte complex, 12 to 45 percent slopes | 7035 | 5 | 3218562 | 2z43r | id713 | | 1:24000 |
Mayhill-Dranyon complex, 10 to 35 percent slopes | 1030 | 12015 | 2427068 | 2mgkj | id716 | | 1:24000 |
Dranyon-Hades-Hagenbarth complex, 10 to 35 percent slopes | 3200 | 9379 | 2495474 | 2pt1s | id716 | | 1:24000 |
Dranyon-Ireland-Buist complex, 12 to 60 percent slopes | 500AA | 6049 | 2425516 | 2mdyg | id716 | | 1:24000 |
Dranburn-Dranyon-Calpac complex, 15 to 50 percent slopes | 7060 | 4131 | 3074038 | 2xxdm | id716 | | 1:24000 |
Booneville-Dranyon-Ireland complex, 20 to 55 percent slopes | 7010 | 3821 | 3074036 | 2xxdk | id716 | | 1:24000 |
Ireland-Hondoho-Dranyon complex, 15 to 50 percent slopes | 2550 | 2778 | 2495470 | 2pt1n | id716 | | 1:24000 |
Chippy-Dranyon complex, 5 to 35 percent slopes | 7070 | 2759 | 3074043 | 2xxds | id716 | | 1:24000 |
Hagenbarth-Dranyon-Crystalbutte complex, 12 to 45 percent slopes | 7035 | 2523 | 3175632 | 2z43r | id716 | | 1:24000 |
Dranyon silt loam, 10 to 40 percent slopes | 79 | 2501 | 3136433 | 2wd4x | id716 | | 1:24000 |
Pavohroo-Lund-Dranyon complex, 12 to 40 percent slopes | 7032 | 2498 | 3156831 | 2yvfc | id716 | | 1:24000 |
Camelback, very deep-Dranyon-Beehunt complex, 8 to 35 percent slopes | 2011 | 2365 | 2989734 | 2x3mx | id716 | | 1:24000 |
Dranyon-Booneville-Hagenbarth complex, 5 to 30 percent slopes | 7005 | 2072 | 3074035 | 2xxdj | id716 | | 1:24000 |
Yago, very bouldery surface-Dranyon-Beaverdam complex, 5 to 30 percent slopes | 2260 | 1669 | 2484143 | 2pcyn | id716 | | 1:24000 |
Cinderspring-Dranyon association, 5 to 40 percent slopes | 7187 | 605 | 3136430 | 2ypjq | id716 | | 1:24000 |
Dranyon-Goodski family, complex, 25 to 55 percent slopes | 894 | 555 | 3163458 | 2wv2q | id716 | | 1:24000 |
Clegg-Drage-Dranyon complex, 12 to 50 percent slopes | 7085 | 541 | 3074042 | 2xxdr | id716 | | 1:24000 |
Ireland-Dranyon-Hagenbarth complex, 20 to 50 percent slopes | 7080 | 473 | 3074041 | 2xxdq | id716 | | 1:24000 |
Pavohroo-Dranyon association, 10 to 30 percent slopes | PDE | 125 | 600014 | n4c9 | id716 | | 1:24000 |
Greys-Dranyon complex, 12 to 30 percent slopes | 43B728 | 910 | 2518572 | 2qf5p | id758 | 1998 | 1:24000 |
Dranyon-Dra complex, 12 to 45 percent slopes | 43B721 | 434 | 2518569 | 2qf5l | id758 | 1998 | 1:24000 |
Dranyon silt loam, 2 to 25 percent slopes | 43B725 | 253 | 2518571 | 2qf5n | id758 | 1998 | 1:24000 |
Greys-Dranyon complex, 2 to 12 percent slopes | 43B730 | 52 | 2518573 | 2qf5q | id758 | 1998 | 1:24000 |
Dranyon silt loam, 4 to 45 percent slope, extremely stony | 9 | 15493 | 84208 | 2tmd | id769 | 1978 | 1:24000 |
Dranyon silt loam, hilly | DRF | 22399 | 79905 | 2p4l | id770 | 1968 | 1:24000 |
Dranyon silt loam, steep | DRG | 3841 | 79906 | 2p4m | id770 | 1968 | 1:24000 |
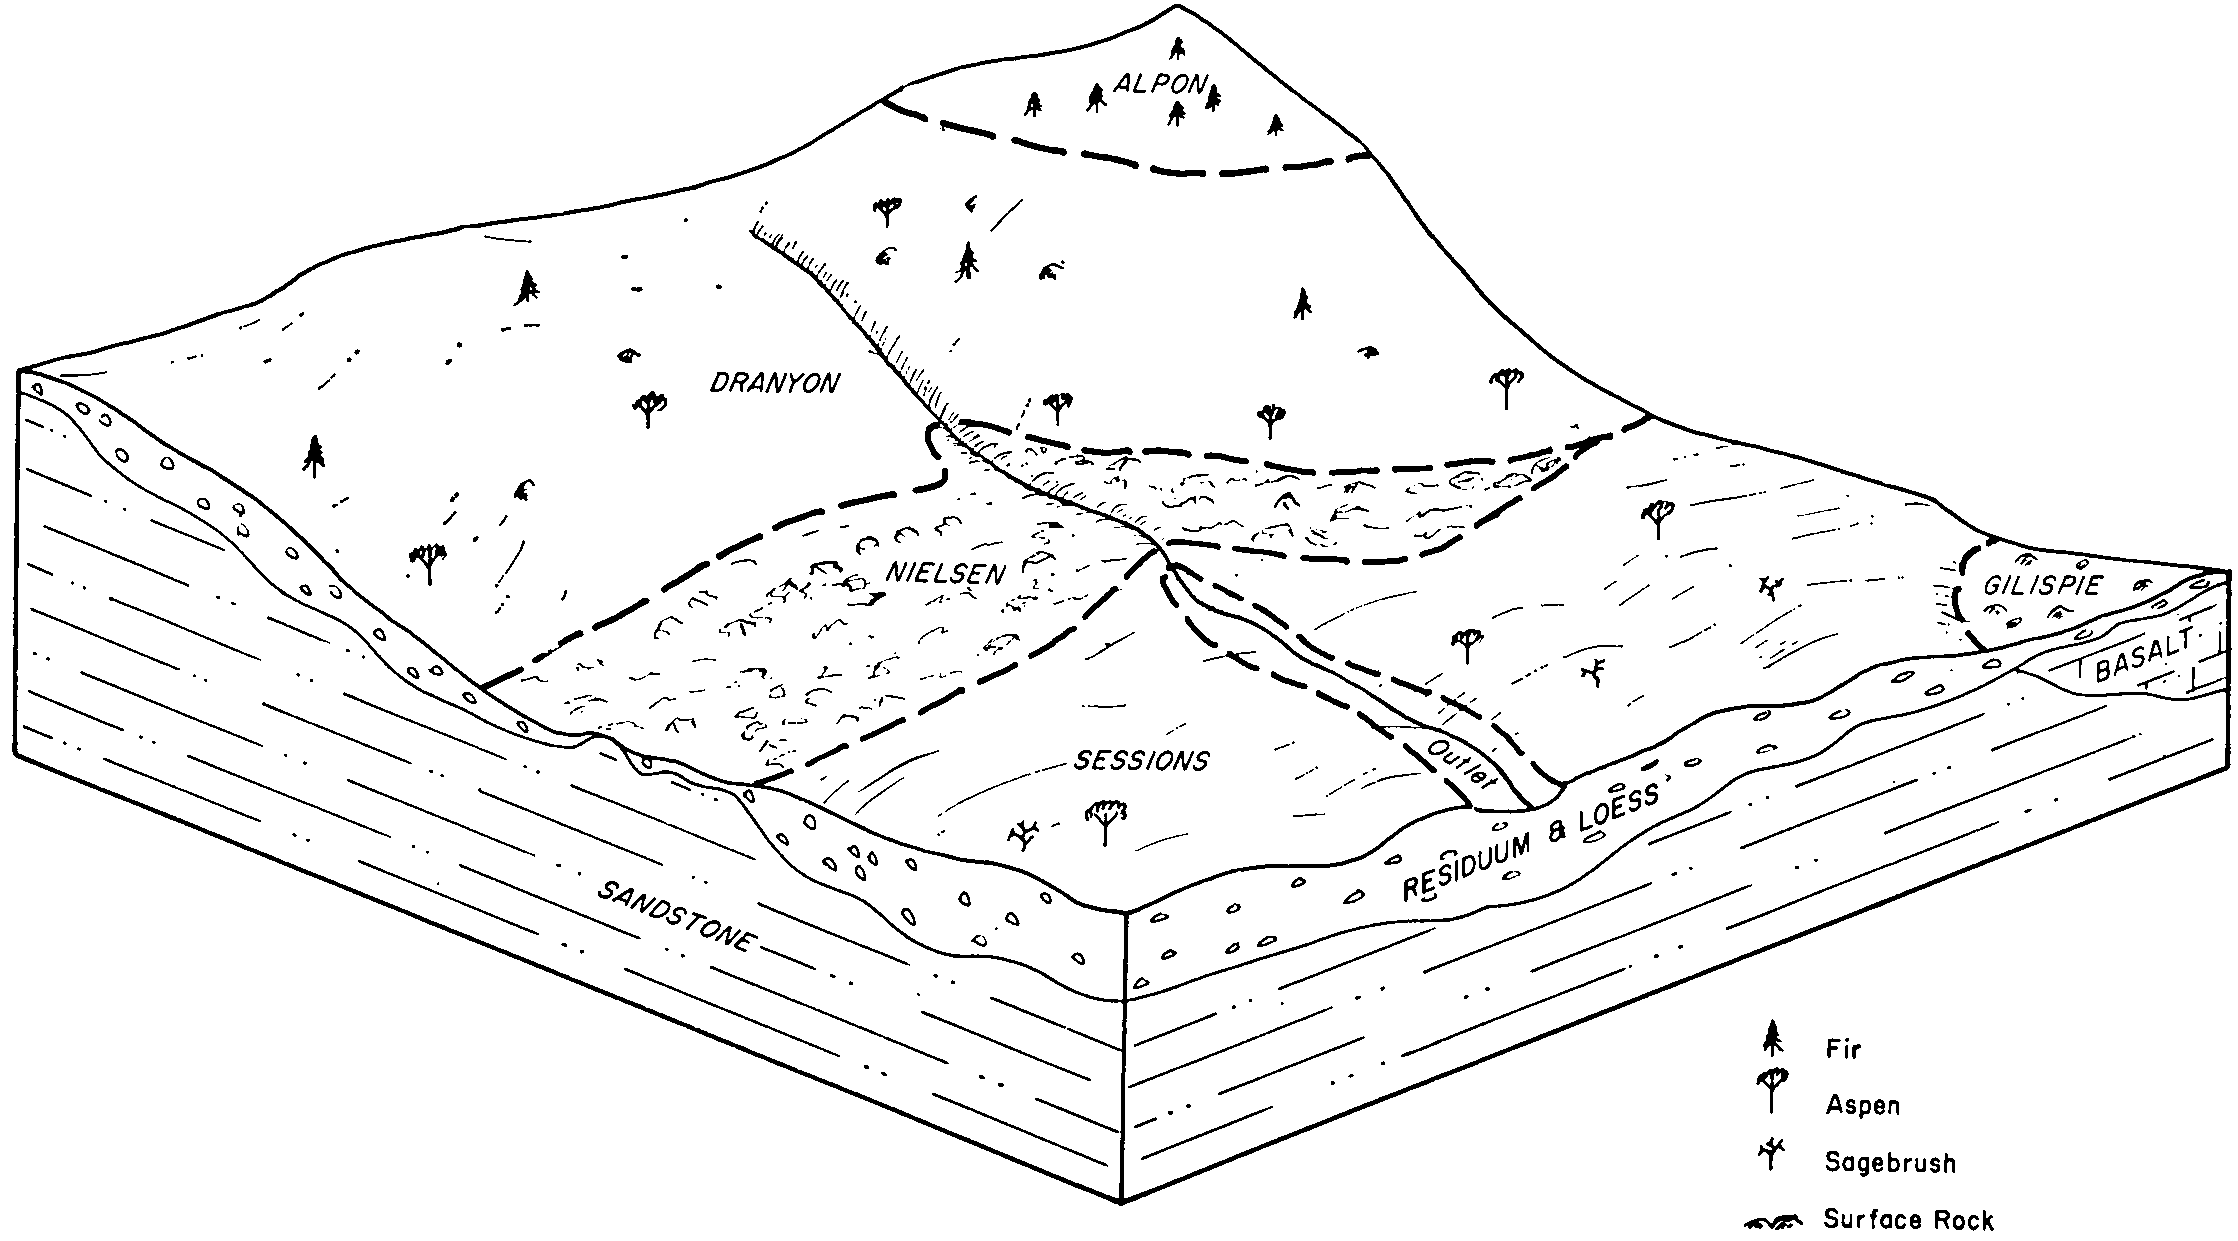
Dranyon-Gilispie complex, hilly | DSF | 1030 | 79907 | 2p4n | id770 | 1968 | 1:24000 |
Dranyon-Hades-Hagenbarth complex, 10 to 35 percent slopes | 3200 | 496 | 3238991 | 2pt1s | id770 | 1968 | 1:24000 |
Camelback, very deep-Dranyon-Beehunt complex, 8 to 35 percent slopes | 2011 | 101 | 3238988 | 2x3mx | id770 | 1968 | 1:24000 |
Dranyon-Ireland-Buist complex, 12 to 60 percent slopes | 500AA | 77 | 3238979 | 2mdyg | id770 | 1968 | 1:24000 |
Dranyon-Tolman variant complex, 8 to 20 percent slopes | 21 | 4866 | 55340 | 1vl5 | ut633 | 1983 | 1:24000 |
Grassyhollow-Conwaycreek-Dranyon complex, 15 to 50 percent slopes | 5623 | 3245 | 2487064 | 2pgzw | wy635 | | 1:24000 |
Beaveridge-Dranyon families, association, 2 to 20 percent slopes | 170 | 18428 | 620401 | ntky | wy661 | 1985 | 1:24000 |
Stringam-Dranyon-Grade families, association, 2 to 24 percent slopes | 364 | 17317 | 620514 | ntpl | wy661 | 1985 | 1:24000 |
Dranyon-Badwater-Coldfeet families, complex, 5 to 30 percent slopes | 373 | 5028 | 2633482 | 2r7fy | wy661 | 1985 | 1:24000 |
Dranyon-Badwater-Coldfeet families, complex, 5 to 30 percent slopes | 373 | 31 | 2633477 | 2r7fy | wy662 | 1998 | 1:24000 |
Quakenasp-Toponce-Dranyon complex, 15 to 35 percent slopes | 8120 | 7735 | 3169698 | 2y0yr | wy723 | | 1:24000 |
Quietus-Swede-Dranyon complex, 15 to 45 percent slopes | 8121 | 7445 | 3169692 | 2y0yk | wy723 | | 1:24000 |
Quakenasp-Philipsburg-Dranyon complex, 15 to 45 percent slopes | 8115 | 6681 | 3169689 | 2y0yg | wy723 | | 1:24000 |
Grassyhollow-Conwaycreek-Dranyon complex, 15 to 50 percent slopes | 5623 | 3627 | 2515434 | 2pgzw | wy723 | | 1:24000 |
Quakenasp-Philipsburg-Dranyon complex, 4 to 15 percent slopes | 8112 | 1975 | 3169686 | 2y0yc | wy723 | | 1:24000 |


