| Collamer silt loam, 8 to 15 percent slopes | 31C | 498 | 299858 | b20v | ny003 | 2013 | 1:24000 |
Collamer silt loam, 15 to 25 percent slopes | 31D | 386 | 318643 | bpkt | ny003 | 2013 | 1:24000 |
Collamer silt loam, 3 to 8 percent slopes | 31B | 330 | 849300 | xhrs | ny003 | 2013 | 1:24000 |
Collamer silt loam, 0 to 3 percent slopes | 31A | 64 | 822859 | wm7v | ny003 | 2013 | 1:24000 |
Collamer silt loam, 8 to 15 percent slopes | 31C | 1327 | 289582 | 9qbc | ny009 | 2002 | 1:24000 |
Collamer silt loam, 3 to 8 percent slopes | 31B | 679 | 289581 | 9qbb | ny009 | 2002 | 1:24000 |
Collamer silt loam, 2 to 6 percent slopes | ClB | 3219 | 289382 | 9q3x | ny011 | 1968 | 1:15840 |
Collamer silt loam, 0 to 2 percent slopes | ClA | 2204 | 289381 | 9q3w | ny011 | 1968 | 1:15840 |
Collamer silt loam, 3 to 8 percent slopes | CsB | 614 | 289811 | 9qkr | ny013 | 1988 | 1:15840 |
Collamer silt loam, 8 to 15 percent slopes | CsC | 376 | 289812 | 9qks | ny013 | 1988 | 1:15840 |
Collamer silt loam, 0 to 3 percent slopes | CoA | 357 | 289915 | 9qp3 | ny015 | 1969 | 1:20000 |
Collamer silt loam, 3 to 8 percent slopes | CoB | 314 | 289916 | 9qp4 | ny015 | 1969 | 1:20000 |
Collamer silt loam, 3 to 8 percent slopes | CoB | 2322 | 290323 | 9r38 | ny021 | 1985 | 1:15840 |
Collamer silt loam, 8 to 15 percent slopes | CoC | 770 | 290324 | 9r39 | ny021 | 1985 | 1:15840 |
Collamer silt loam, 0 to 3 percent slopes | CoA | 653 | 290322 | 9r37 | ny021 | 1985 | 1:15840 |
Collamer silt loam, 8 to 15 percent slopes | CoC | 332 | 290473 | 9r83 | ny025 | 1999 | 1:24000 |
Collamer silt loam, 3 to 8 percent slopes | CoB | 157 | 290472 | 9r82 | ny025 | 1999 | 1:24000 |
Collamer silt loam, 3 to 8 percent slopes | CsB | 2693 | 290783 | 9rl3 | ny029 | 1979 | 1:15840 |
Collamer silt loam, till substratum, 3 to 8 percent slo pes | CtB | 2259 | 290785 | 9rl5 | ny029 | 1979 | 1:15840 |
Urban land-Collamer complex, 1 to 6 percent slopes | UmA | 2218 | 290914 | 9rqb | ny029 | 1979 | 1:15840 |
Collamer silt loam, 8 to 15 percent slopes | CsC | 961 | 290784 | 9rl4 | ny029 | 1979 | 1:15840 |
Collamer silt loam, 0 to 3 percent slopes | CsA | 511 | 290782 | 9rl2 | ny029 | 1979 | 1:15840 |
Collamer silt loam, 2 to 8 percent slopes | CrB | 791 | 316458 | bm9b | ny031 | 2007 | 1:24000 |
Collamer silt loam, 2 to 6 percent slopes | ClB | 4557 | 301688 | b3xw | ny037 | 2004 | 1:24000 |
Collamer silt loam, 3 to 8 percent slopes | CnB | 20124 | 291800 | 9smx | ny045 | 1981 | 1:15840 |
Collamer silt loam, 8 to 15 percent slopes | CnC | 4246 | 291801 | 9smy | ny045 | 1981 | 1:15840 |
Collamer silt loam, bedrock substratum, 3 to 8 percent slopes | CoB | 3560 | 291803 | 9sn0 | ny045 | 1981 | 1:15840 |
Collamer silt loam, 8 to 15 percent slopes, severely eroded | CnC3 | 419 | 291802 | 9smz | ny045 | 1981 | 1:15840 |
Collamer silt loam, 8 to 15 percent slopes | 31C | 2046 | 3105667 | 2y9vy | ny051 | 2019 | 1:24000 |
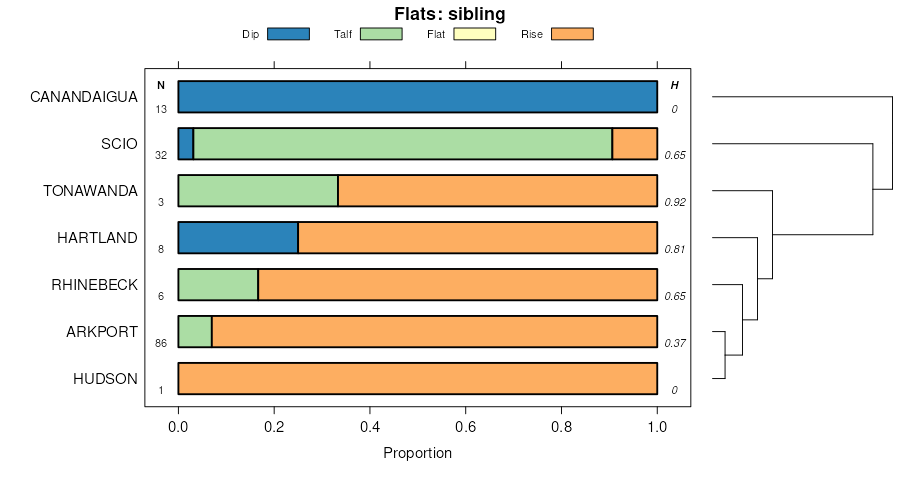
Hudson and Collamer soils, 8 to 15 percent slopes | 132C | 1155 | 3105730 | 2y9x2 | ny051 | 2019 | 1:24000 |
Hudson and Collamer soils, 15 to 25 percent slopes | 132D | 914 | 3105731 | 2y9x3 | ny051 | 2019 | 1:24000 |
Collamer silt loam, 3 to 8 percent slopes | 31B | 904 | 3105666 | 2y9vx | ny051 | 2019 | 1:24000 |
Hudson and Collamer soils, 3 to 8 percent slopes | 132B | 846 | 3105729 | 2y9x1 | ny051 | 2019 | 1:24000 |
Collamer silt loam, 15 to 25 percent slopes | 31D | 772 | 3105668 | 2y9vz | ny051 | 2019 | 1:24000 |
Hudson and Collamer soils, 25 to 35 percent slopes | 132E | 646 | 3105732 | 2y9x5 | ny051 | 2019 | 1:24000 |
Hudson and Collamer soils, 0 to 3 percent slopes | 132A | 3 | 3105728 | 2y9x0 | ny051 | 2019 | 1:24000 |
Collamer silt loam, 3 to 8 percent slopes | CkB | 700 | 292541 | 9tdt | ny053 | 1975 | 1:15840 |
Collamer silt loam, rolling | CkC | 611 | 292542 | 9tdv | ny053 | 1975 | 1:15840 |
Collamer silt loam, 0 to 3 percent slopes | CkA | 396 | 292540 | 9tds | ny053 | 1975 | 1:15840 |
Collamer silt loam, hilly | CkD | 310 | 292543 | 9tdw | ny053 | 1975 | 1:15840 |
Collamer silt loam, 2 to 6 percent slopes | ClB | 14288 | 292682 | 9tkc | ny055 | 1967 | 1:15840 |
Collamer silt loam, 0 to 2 percent slopes | ClA | 9962 | 292681 | 9tkb | ny055 | 1967 | 1:15840 |
Collamer silt loam, loamy subsoil variant, 2 to 6 percent slopes | CmB | 1515 | 292685 | 9tkg | ny055 | 1967 | 1:15840 |
Collamer silt loam, loamy subsoil variant, 0 to 2 percent slopes | CmA | 1097 | 292684 | 9tkf | ny055 | 1967 | 1:15840 |
Collamer silt loam, 6 to 12 percent slopes | ClC | 732 | 292683 | 9tkd | ny055 | 1967 | 1:15840 |
Collamer silt loam, 3 to 8 percent slopes | 77B | 434 | 293486 | 9vd9 | ny065 | 1993 | 1:24000 |
Collamer silt loam, 15 to 25 percent slopes | 77D | 395 | 293488 | 9vdc | ny065 | 1993 | 1:24000 |
Collamer silt loam, 8 to 15 percent slopes | 77C | 394 | 293487 | 9vdb | ny065 | 1993 | 1:24000 |
Collamer silt loam, 0 to 3 percent slopes | 77A | 203 | 293485 | 9vd8 | ny065 | 1993 | 1:24000 |
Collamer silt loam, 2 to 6 percent slopes | ChB | 13303 | 293549 | 9vgb | ny067 | 1973 | 1:20000 |
Collamer silt loam, 0 to 2 percent slopes | ChA | 4494 | 293548 | 9vg9 | ny067 | 1973 | 1:20000 |
Collamer silt loam, 0 to 3 percent slopes | 31A | 1825 | 2378286 | 2ktsx | ny069 | 2012 | 1:12000 |
Collamer silt loam, 15 to 25 percent slopes | 31D | 1109 | 2378285 | 2ktsw | ny069 | 2012 | 1:12000 |
Collamer silt loam, 3 to 8 percent slopes | 31B | 849 | 2378288 | 2ktsz | ny069 | 2012 | 1:12000 |
Collamer silt loam, 8 to 15 percent slopes | 31C | 776 | 2378287 | 2ktsy | ny069 | 2012 | 1:12000 |
Collamer silt loam, 3 to 8 percent slopes | CoB | 514 | 293915 | 9vv4 | ny071 | 1976 | 1:15840 |
Collamer silt loam, 8 to 15 percent slopes | CoC | 151 | 293916 | 9vv5 | ny071 | 1976 | 1:15840 |
Collamer silt loam, 15 to 25 percent slopes | CoD | 150 | 293917 | 9vv6 | ny071 | 1976 | 1:15840 |
Collamer silt loam, 2 to 6 percent slopes | CmB | 11063 | 294019 | 9vyh | ny073 | 1973 | 1:15840 |
Arkport-Collamer complex, 6 to 20 percent slopes | AsD | 1098 | 293999 | 9vxv | ny073 | 1973 | 1:15840 |
Collamer silt loam, 0 to 2 percent slopes | CmA | 926 | 294018 | 9vyg | ny073 | 1973 | 1:15840 |
Collamer silt loam, 6 to 12 percent slopes, severely eroded | CmC3 | 580 | 294020 | 9vyj | ny073 | 1973 | 1:15840 |
Collamer silt loam, 3 to 8 percent slopes | CrB | 384 | 294599 | 9wk6 | ny097 | 1976 | 1:15840 |
Collamer silt loam, 0 to 3 percent slopes | CrA | 133 | 294598 | 9wk5 | ny097 | 1976 | 1:15840 |
Collamer silt loam, 2 to 6 percent slopes | ClB | 2692 | 294701 | 9wnh | ny099 | 1966 | 1:15840 |
Collamer silt loam, 0 to 2 percent slopes | ClA | 2496 | 294700 | 9wng | ny099 | 1966 | 1:15840 |
Collamer silt loam, moderately shallow variant, 2 to 6 percent slopes | CoB | 402 | 294703 | 9wnk | ny099 | 1966 | 1:15840 |
Collamer silt loam, moderately shallow variant, 0 to 2 percent slopes | CoA | 186 | 294702 | 9wnj | ny099 | 1966 | 1:15840 |
Collamer silt loam, 6 to 12 percent slopes | ClC | 70 | 294697 | 9wnc | ny099 | 1966 | 1:15840 |
Collamer silt loam, rolling | CoC | 740 | 294799 | 9wrn | ny101 | 1972 | 1:15840 |
Hudson and Collamer silt loams, 2 to 6 percent slopes | HwB | 844 | 295629 | 9xmf | ny109 | 1963 | 1:20000 |
Collamer silt loam, 2 to 6 percent slopes | CrB | 3550 | 295714 | 9xq5 | ny117 | 1972 | 1:15840 |
Collamer silt loam, 3 to 8 percent slopes | CoB | 907 | 295331 | 9x9t | ny121 | 1969 | 1:20000 |
Collamer silt loam, 8 to 15 percent slopes | CoC | 818 | 295332 | 9x9v | ny121 | 1969 | 1:20000 |
Collamer silt loam, 15 to 25 percent slopes | CoD | 489 | 295333 | 9x9w | ny121 | 1969 | 1:20000 |
Collamer silt loam, 3 to 8 percent slopes | CsB | 139 | 289256 | 9pzv | ny605 | 1981 | 1:24000 |
Collamer silt loam, till substratum, 3 to 8 percent slopes | CtB | 54 | 289258 | 9pzx | ny605 | 1981 | 1:24000 |
Collamer silt loam, 8 to 15 percent slopes | CsC | 22 | 289257 | 9pzw | ny605 | 1981 | 1:24000 |
Collamer silt loam, 2 to 6 percent slopes | CnB | 6352 | 292985 | 9tw4 | ny664 | 1968 | 1:15840 |
Collamer silt loam, 0 to 2 percent slopes | CnA | 3823 | 292984 | 9tw3 | ny664 | 1968 | 1:15840 |
Collamer silt loam, 15 to 25 percent slopes | CoD | 82 | 2633108 | 2rg8p | pa049 | 2012 | 1:12000 |
Collamer silt loam, 8 to 15 percent slopes | CoC | 40 | 2633109 | 2rg8q | pa049 | 2012 | 1:12000 |