| Cochetopa clay loam, 2 to 6 percent slopes | 23 | 2887 | 498287 | jqhs | co637 | 1986 | 1:24000 |
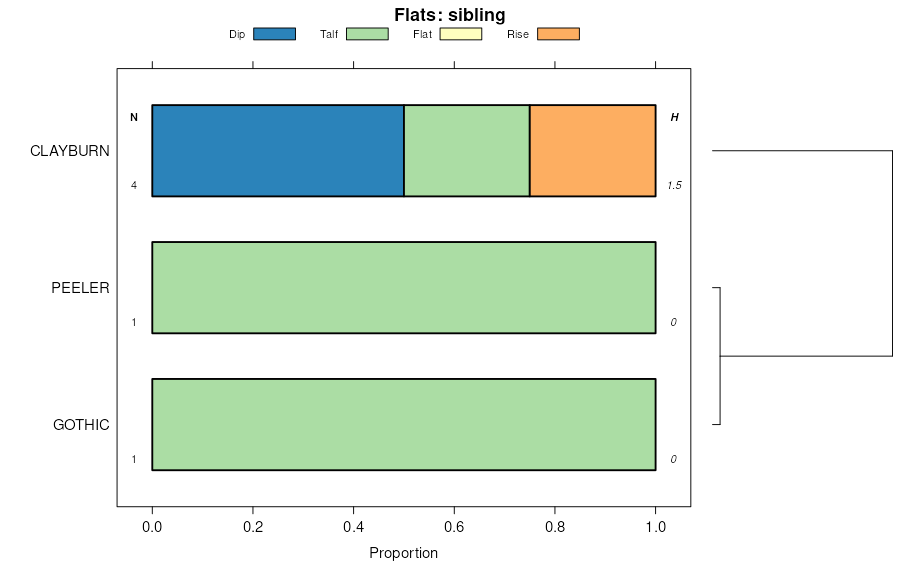
Cochetopa-Gothic complex, 25 to 45 percent slopes, extremely stony | 41 | 91 | 3106859 | jpd8 | co648 | | 1:24000 |
Cochetopa-Antrobus, extremely stony association, 25 to 50 percent slopes | AG19 | 74 | 1415077 | 1jhhn | co654 | | 1:24000 |
Cochetopa-Antrobus association, 12 to 25 percent slopes | 18 | 25955 | 497956 | jq53 | co655 | 1984 | 1:24000 |
Cochetopa-Antrobus association, 25 to 50 percent slopes | 19 | 13702 | 497957 | jq54 | co655 | 1984 | 1:24000 |
Cochetopa-Antrobus association, 6 to 12 percent slopes | 17 | 4315 | 497955 | jq52 | co655 | 1984 | 1:24000 |
Cochetopa-Clayburn complex, 12 to 40 percent slopes | 125 | 1085 | 509473 | k34m | co660 | 1994 | 1:24000 |
Cochetopa loam, 5 to 30 percent slopes | CoE | 8931 | 498192 | jqdq | co662 | 1968 | 1:24000 |
Cochetopa-Harkness association, 10 to 50 percent slopes | 118 | 1260 | 2453835 | 2ncdz | co664 | 1987 | 1:24000 |
Cochetopa stony loam, 10 to 40 percent slopes | 25 | 15020 | 496601 | jnrd | co679 | 1976 | 1:24000 |
Cochetopa-Clayburn complex, 12 to 40 percent slopes | 24 | 11211 | 496684 | jnv2 | co682 | 1986 | 1:24000 |
Cochetopa loam, 9 to 50 percent slopes | 17 | 17100 | 496756 | 2w4zr | co683 | 1977 | 1:24000 |
Cochetopa-Jerry complex, 25 to 50 percent slopes | 19 | 14700 | 496758 | jnxg | co683 | 1977 | 1:24000 |
Cochetopa-Jerry complex, 12 to 25 percent slopes | 18 | 1200 | 496757 | jnxf | co683 | 1977 | 1:24000 |
Cochetopa-Adel-Hapgood loams, 5 to 25 percent slopes | 18 | 17025 | 496857 | jp0n | co684 | 1984 | 1:24000 |
Anvik, warm-Cochetopa-Passar complex, 3 to 25 percent slopes | 9 | 9926 | 496936 | jp36 | co684 | 1984 | 1:24000 |
Cochetopa-Adel-Hapgood loams, 25 to 45 percent slopes | 19 | 8845 | 496858 | jp0p | co684 | 1984 | 1:24000 |
Cowdrey-Cochetopa-Quander loams, 5 to 25 percent slopes | 32 | 7452 | 496873 | jp15 | co684 | 1984 | 1:24000 |
Cochetopa-Jerry loams, 12 to 25 percent slopes | 28 | 7174 | 496868 | jp10 | co684 | 1984 | 1:24000 |
Cochetopa-Gothic-Quander loams, 5 to 25 percent slopes | 25 | 7017 | 496865 | jp0x | co684 | 1984 | 1:24000 |
Cochetopa-Gothic-Hapgood loams, 5 to 25 percent slopes | 23 | 6420 | 496863 | jp0v | co684 | 1984 | 1:24000 |
Cochetopa-Antrobus complex, 5 to 25 percent slopes | 20 | 5514 | 496860 | jp0r | co684 | 1984 | 1:24000 |
Adel-Cochetopa-Mayoworth loams, 25 to 65 percent slopes | 2 | 4908 | 496859 | jp0q | co684 | 1984 | 1:24000 |
Adel-Cochetopa-Mayoworth loams, 5 to 25 percent slopes | 1 | 4851 | 496821 | jnzh | co684 | 1984 | 1:24000 |
Cochetopa loam, 9 to 50 percent slopes | 17 | 4818 | 496856 | jp0m | co684 | 1984 | 1:24000 |
Hapgood-Clayburn-Cochetopa loams, 20 to 65 percent slopes | 55 | 4172 | 496898 | jp1z | co684 | 1984 | 1:24000 |
Cochetopa-Clayburn-Emerald loams, 5 to 25 percent slopes | 21 | 4092 | 496861 | jp0s | co684 | 1984 | 1:24000 |
Cochetopa-Clayburn-Emerald loams, 25 to 65 percent slopes | 22 | 3206 | 496862 | jp0t | co684 | 1984 | 1:24000 |
Cochetopa-Gothic-Hapgood loams, 25 to 65 percent slopes | 24 | 2375 | 496864 | jp0w | co684 | 1984 | 1:24000 |
Cochetopa-Gothic-Quander loams, 25 to 65 percent slopes | 26 | 2116 | 496866 | jp0y | co684 | 1984 | 1:24000 |
Cochetopa-Gourley-Quander complex, 5 to 25 percent slopes | 27 | 1870 | 496867 | jp0z | co684 | 1984 | 1:24000 |
Hapgood-Dunlatop-Cochetopa loams, 20 to 65 percent slopes | 56 | 509 | 496899 | jp20 | co684 | 1984 | 1:24000 |
Cochetopa loam, 9 to 50 percent slopes | 23 | 2364 | 496972 | 2w4zr | co685 | 1979 | 1:24000 |
Cochetopa-Jerry loams, 12 to 25 percent slopes | 24 | 1518 | 496973 | jp4d | co685 | 1979 | 1:24000 |
Routt-Cochetopa-Binco complex, 10 to 30 percent slopes, extremely stony | 167 | 15239 | 497132 | jp9j | co686 | 1992 | 1:31680 |
Cochetopa loam, 12 to 25 percent slopes | 37 | 7452 | 497212 | jpd3 | co686 | 1992 | 1:31680 |
Cochetopa-Gothic complex, 10 to 25 percent slopes, extremely bouldery | 40 | 6647 | 497216 | jpd7 | co686 | 1992 | 1:31680 |
Cochetopa-Gothic complex, 25 to 45 percent slopes, extremely stony | 41 | 6219 | 497217 | jpd8 | co686 | 1992 | 1:31680 |
Cochetopa-Jerry complex, 3 to 15 percent slopes, extremely stony | 42 | 4679 | 497218 | jpd9 | co686 | 1992 | 1:31680 |
Cochetopa loam, warm, 3 to 12 percent slopes | 39 | 4147 | 497214 | jpd5 | co686 | 1992 | 1:31680 |
Cochetopa loam, 25 to 65 percent slopes | 38 | 3403 | 497213 | jpd4 | co686 | 1992 | 1:31680 |
Jerry-Cochetopa complex, 5 to 35 percent slopes | 108 | 3214 | 497067 | jp7f | co686 | 1992 | 1:31680 |
Cochetopa-Trout Creek families, complex, 0 to 10 percent slopes | 70 | 18292 | 708349 | rs2z | wy632 | | 1:24000 |
Cochetopa-Trout Creek families, complex, 10 to 25 percent slopes | 71 | 9411 | 708355 | rs35 | wy632 | | 1:24000 |
Cowdrey-Cochetopa families, complex, 25 to 40 percent slopes | 25 | 6193 | 707864 | rrlb | wy632 | | 1:24000 |
Trout Creek-Cochetopa families, complex, 25 to 40 percent slopes | 69 | 5550 | 708350 | rs30 | wy632 | | 1:24000 |
Cochetopa-Ute families, complex, 0 to 10 percent slopes | 98 | 3187 | 708431 | rs5m | wy632 | | 1:24000 |
Cochetopa-Ute families, complex, 10 to 25 percent slopes | 99 | 1054 | 708435 | rs5r | wy632 | | 1:24000 |
Cochetopa family-Mollic Palecryalfs complex, 0 to 15 percent slopes | 201 | 2000 | 151952 | 533p | wy663 | 2012 | 1:24000 |