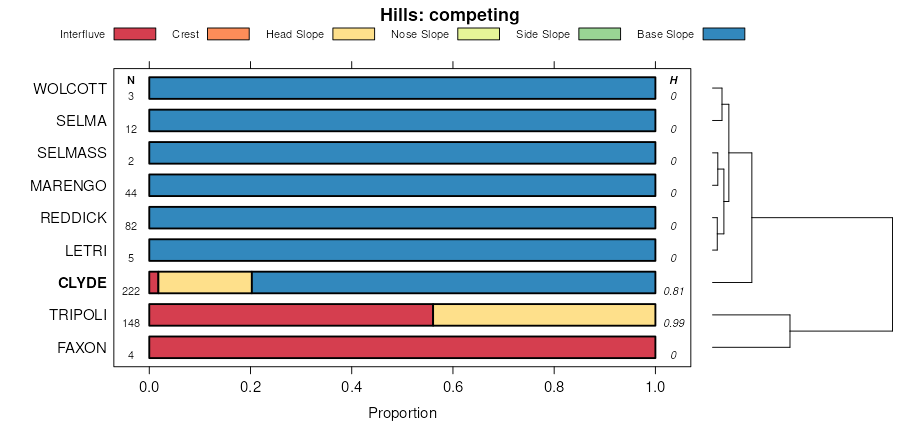
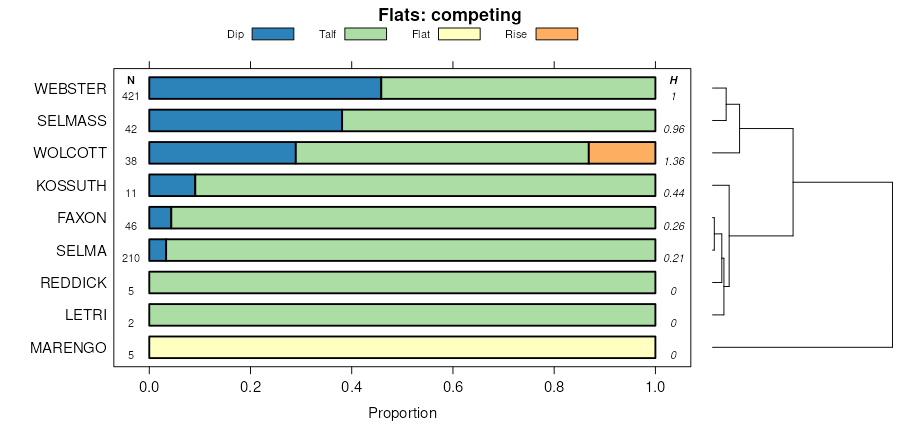
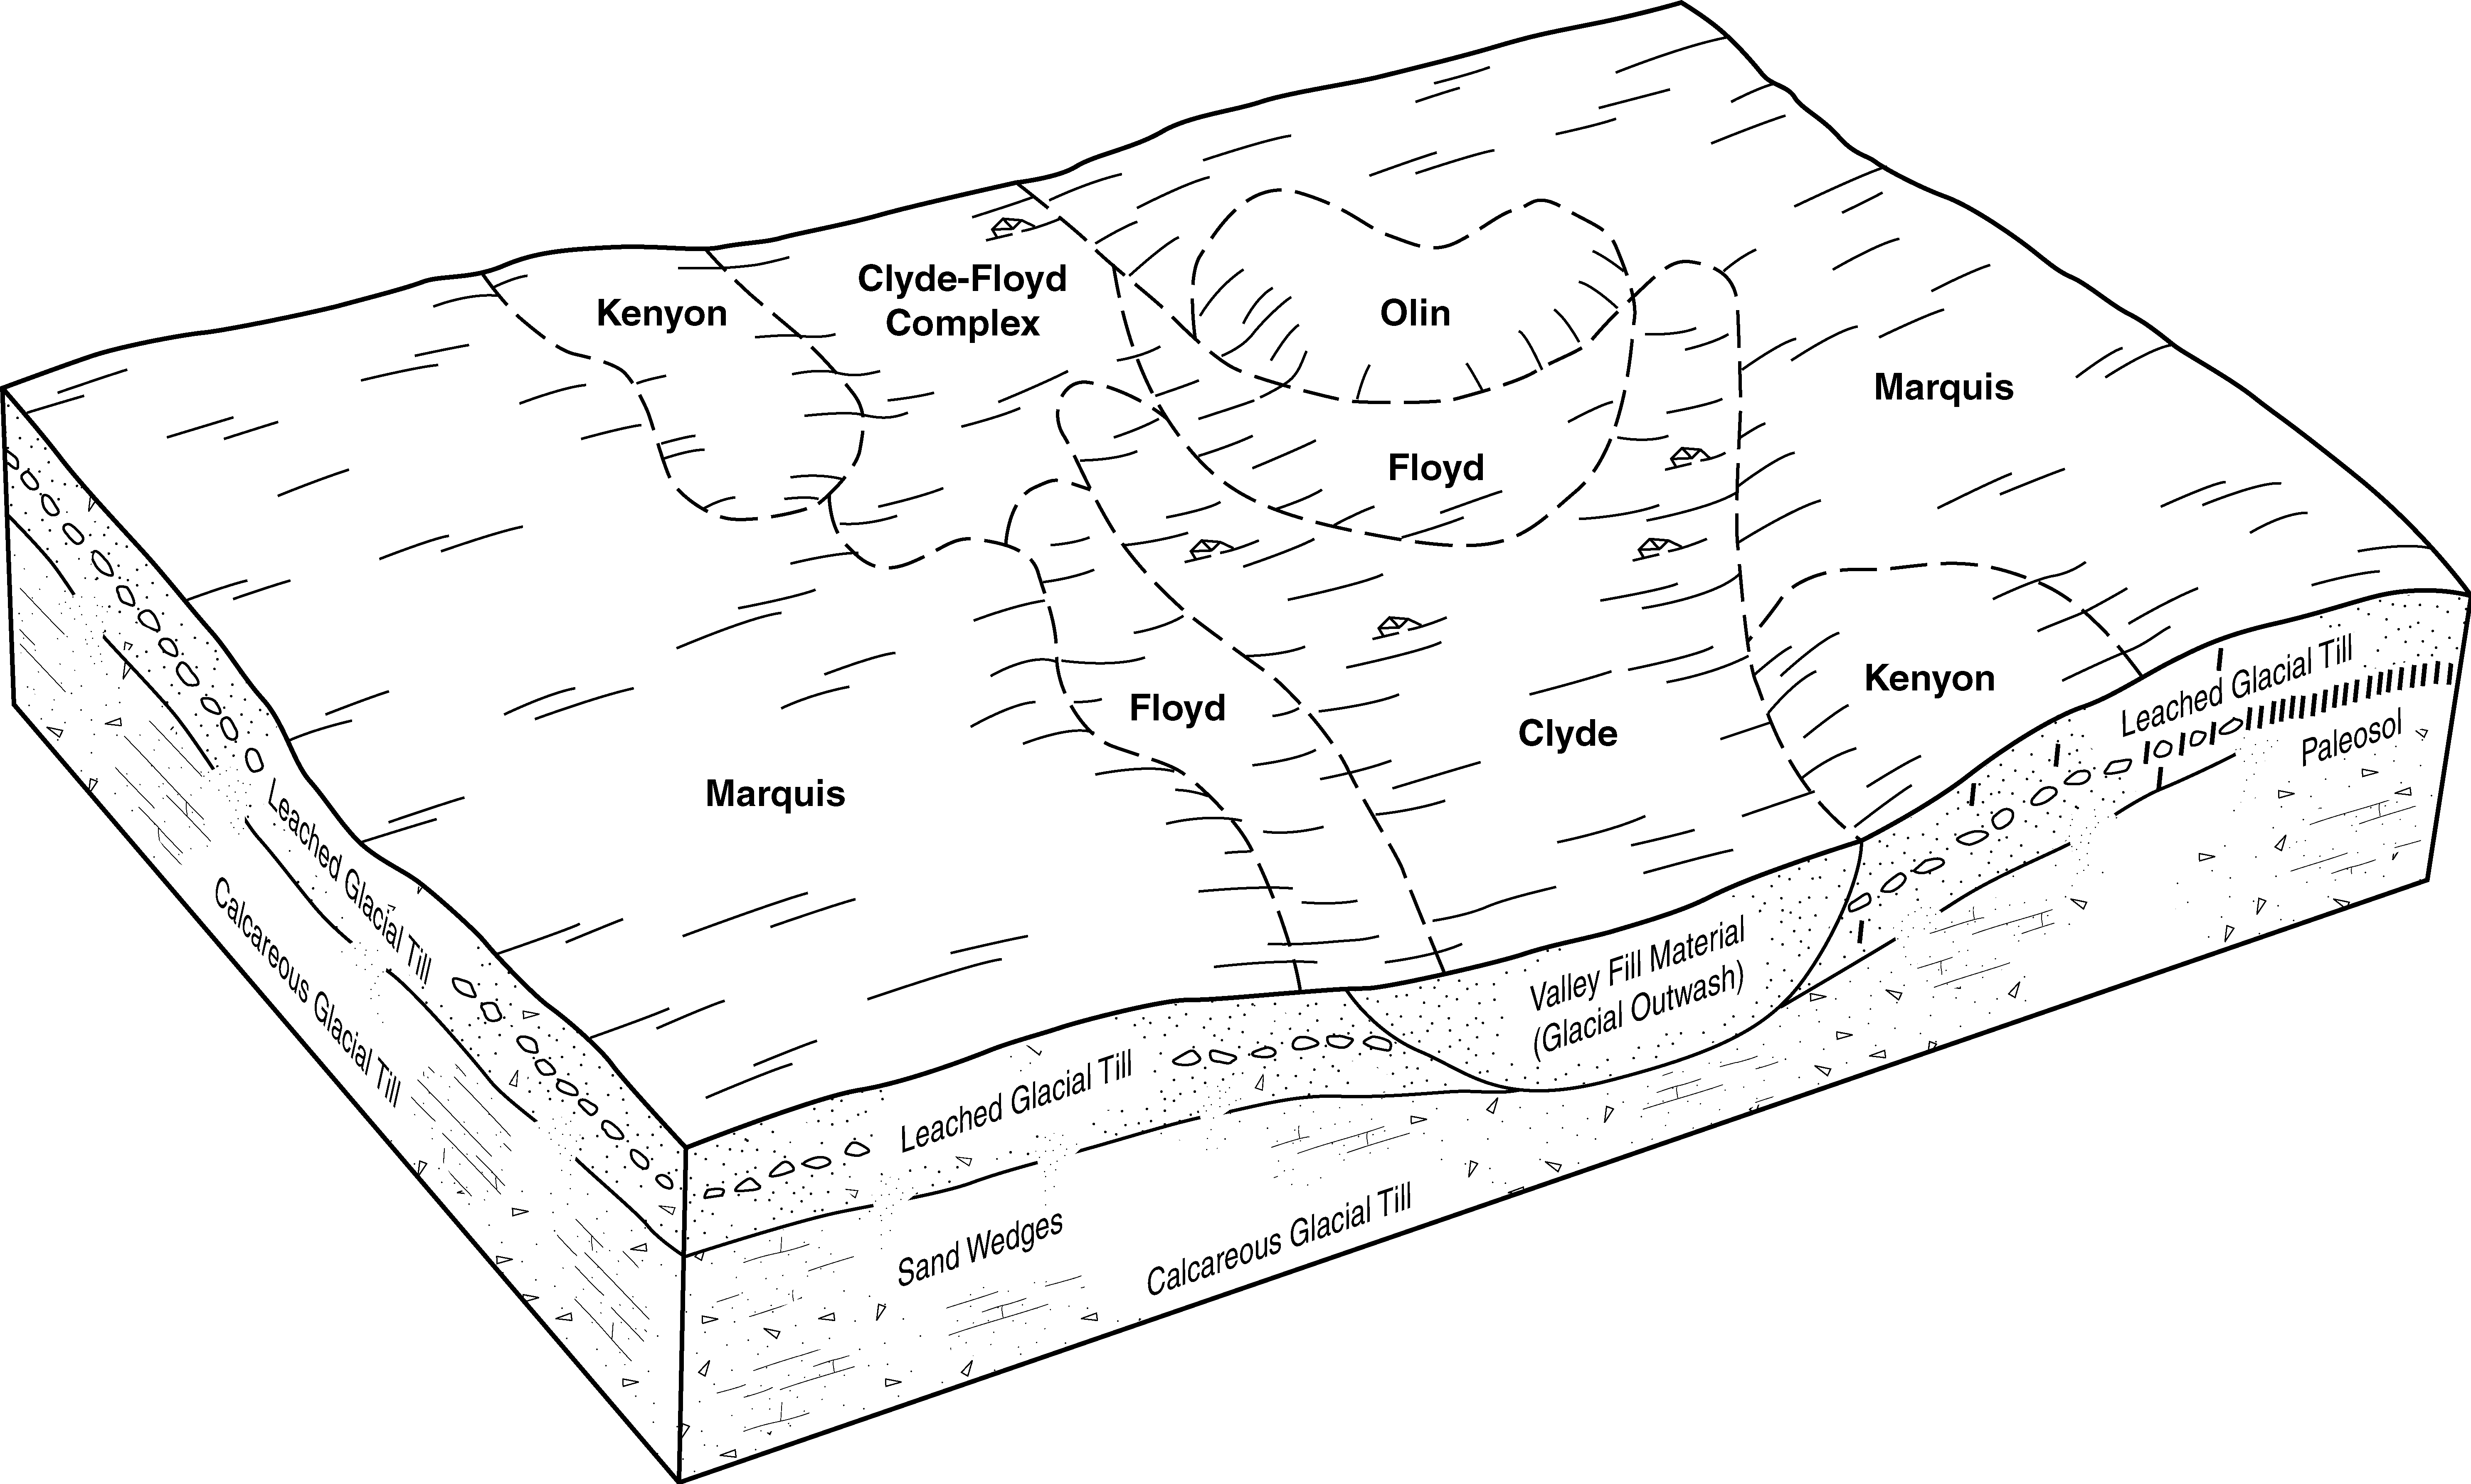
| Clyde-Floyd complex, 1 to 4 percent slopes | 391B | 11469 | 402882 | 2sj90 | ia011 | 1977 | 1:15840 |
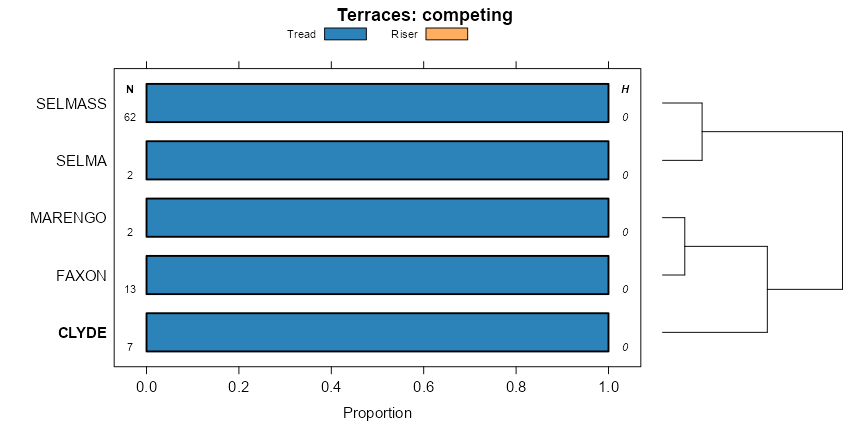
Clyde silty clay loam, 0 to 3 percent slopes | 84 | 1672 | 402927 | 2shby | ia011 | 1977 | 1:15840 |
Clyde-Floyd complex, 1 to 4 percent slopes | 391B | 32164 | 413250 | 2sj90 | ia013 | 2001 | 1:12000 |
Clyde silty clay loam, 0 to 3 percent slopes | 84 | 11637 | 413204 | 2shby | ia013 | 2001 | 1:12000 |
Clyde-Floyd-Urban land complex, 0 to 5 percent slopes | 4391B | 2452 | 413317 | 2sj92 | ia013 | 2001 | 1:12000 |
Clyde-Urban land complex, 0 to 3 percent slopes | 4084 | 24 | 449407 | 2t3dr | ia013 | 2001 | 1:12000 |
Clyde silty clay loam, 0 to 3 percent slopes | 84 | 28153 | 1585972 | 2shby | ia017 | 2008 | 1:12000 |
Clyde-Floyd complex, 1 to 4 percent slopes | 391B | 3147 | 1585997 | 2sj90 | ia017 | 2008 | 1:12000 |
Clyde-Floyd complex, 1 to 4 percent slopes | 391B | 87078 | 403232 | 2sj90 | ia019 | 1978 | 1:15840 |
Clyde clay loam, 0 to 3 percent slopes | 84 | 14517 | 403269 | 2s9y6 | ia019 | 1978 | 1:15840 |
Clyde silty clay loam, 0 to 3 percent slopes | 84 | 30389 | 403446 | 2shby | ia023 | 1978 | 1:15840 |
Clyde-Floyd complex, 1 to 4 percent slopes | 391B | 12906 | 403396 | 2sj90 | ia023 | 1978 | 1:15840 |
Clyde silty clay loam, 0 to 3 percent slopes | 84 | 30181 | 403893 | 2shby | ia033 | 1978 | 1:15840 |
Clyde-Floyd complex, 1 to 4 percent slopes | 391B | 1169 | 403834 | 2sj90 | ia033 | 1978 | 1:15840 |
Clyde clay loam, 0 to 3 percent slopes | 84 | 50423 | 404092 | 2s9y6 | ia037 | 1989 | 1:15840 |
Clyde-Floyd complex, 1 to 4 percent slopes | 391B | 27079 | 404027 | 2sj90 | ia037 | 1989 | 1:15840 |
Clyde-Floyd complex, 1 to 4 percent slopes | 391B | 3805 | 404254 | 2sj90 | ia043 | 1979 | 1:15840 |
Clyde clay loam, 0 to 3 percent slopes | 84 | 350 | 404316 | 2s9y6 | ia043 | 1979 | 1:15840 |
Clyde silty clay loam, 0 to 3 percent slopes | 84 | 1158 | 404466 | 2shby | ia045 | 1978 | 1:15840 |
Clyde-Floyd complex, 1 to 4 percent slopes | 591B | 771 | 404442 | 2sj90 | ia045 | 1978 | 1:15840 |
Clyde-Floyd complex, 1 to 4 percent slopes | 391B | 66572 | 405039 | 2sj90 | ia055 | 1984 | 1:15840 |
Clyde clay loam, 0 to 3 percent slopes | 84 | 965 | 405094 | 2s9y6 | ia055 | 1984 | 1:15840 |
Clyde-Floyd complex, 1 to 4 percent slopes | 391B | 3093 | 405418 | 2sj90 | ia061 | 1983 | 1:15840 |
Clyde loam, 0 to 2 percent slopes | 84 | 1013 | 405483 | 2t3dp | ia061 | 1983 | 1:15840 |
Clyde clay loam, 0 to 3 percent slopes | 84 | 42908 | 405827 | 2s9y6 | ia065 | 1975 | 1:15840 |
Clyde-Floyd complex, 1 to 4 percent slopes | 391B | 27303 | 405761 | 2sj90 | ia065 | 1975 | 1:15840 |
Clyde silty clay loam, 0 to 3 percent slopes | 84 | 33451 | 406052 | 2shby | ia067 | 1989 | 1:15840 |
Clyde-Floyd complex, 1 to 4 percent slopes | 391B | 6688 | 405912 | 2sj90 | ia067 | 1989 | 1:15840 |
Clyde silty clay loam, 0 to 3 percent slopes | 84 | 2243 | 404963 | 2shby | ia069 | 1977 | 1:15840 |
Clyde-Floyd complex, 1 to 4 percent slopes | 391B | 1000 | 404907 | 2sj90 | ia069 | 1977 | 1:15840 |
Clyde silty clay loam, 0 to 3 percent slopes | 84 | 11651 | 406324 | 2shby | ia075 | 1973 | 1:15840 |
Clyde-Floyd complex, 1 to 4 percent slopes | 391B | 4702 | 406302 | 2sj90 | ia075 | 1973 | 1:15840 |
Clyde silty clay loam, 0 to 3 percent slopes | 84 | 44692 | 407003 | 2shby | ia089 | 1969 | 1:15840 |
Clyde-Floyd complex, 1 to 4 percent slopes | 391B | 7009 | 406942 | 2sj90 | ia089 | 1969 | 1:15840 |
Clyde muck, 1 to 4 percent slopes | 21 | 395 | 406922 | 2yvjp | ia089 | 1969 | 1:15840 |
Clyde silty clay loam, 0 to 3 percent slopes | 84 | 6072 | 408217 | 2shby | ia105 | 1988 | 1:15840 |
Clyde-Floyd complex, 1 to 4 percent slopes | 391B | 5299 | 408150 | 2sj90 | ia105 | 1988 | 1:15840 |
Clyde silty clay loam, 0 to 3 percent slopes | 84 | 22150 | 408688 | 2shby | ia113 | 1970 | 1:15840 |
Clyde-Floyd complex, 1 to 4 percent slopes | 391B | 13409 | 408624 | 2sj90 | ia113 | 1970 | 1:15840 |
Clyde-Floyd-Urban land complex, 0 to 5 percent slopes | 4391B | 608 | 2606465 | 2sj92 | ia113 | 1970 | 1:15840 |
Clyde silty clay loam, 0 to 3 percent slopes | 84 | 21645 | 409725 | 2shby | ia131 | 1971 | 1:15840 |
Clyde-Floyd complex, 1 to 4 percent slopes | 391B | 5617 | 409668 | 2sj90 | ia131 | 1971 | 1:15840 |
Clyde clay loam, 0 to 3 percent slopes | 84 | 1079 | 411072 | 2s9y6 | ia163 | 1989 | 1:15840 |
Clyde silt loam, 0 to 3 percent slopes | 84 | 6155 | 437397 | 2t3dq | ia191 | 2005 | 1:12000 |
Clyde-Floyd complex, 1 to 4 percent slopes | 391B | 2941 | 450126 | 2sj90 | ia191 | 2005 | 1:12000 |
Clyde silty clay loam, 0 to 3 percent slopes | 84 | 8079 | 2398676 | 2shby | ia195 | 2012 | 1:12000 |
Clyde clay loam, 0 to 2 percent slopes | 648A | 15335 | 942140 | 10mcm | il103 | 2004 | 1:12000 |
Clyde-Floyd complex, 1 to 4 percent slopes | M518B | 31253 | 1384968 | 1hh5d | mn039 | 2005 | 1:12000 |
Clyde silty clay loam, 0 to 3 percent slopes | M517A | 6504 | 1384967 | 2shby | mn039 | 2005 | 1:12000 |
Floyd and Clyde silty clay loams, overwash, 0 to 3 percent slopes | Fn | 15329 | 2216745 | 2ddpx | mn045 | 2008 | 1:12000 |
Clyde silty clay loam, 0 to 3 percent slopes | Cg | 2358 | 2216710 | 2shby | mn045 | 2008 | 1:12000 |
Clyde silty clay loam, overwash | Ch | 1822 | 2216711 | 2ddnt | mn045 | 2008 | 1:12000 |
Clyde silty clay loam, 0 to 3 percent slopes | M517A | 48 | 3176272 | 2shby | mn047 | 1977 | 1:15840 |
Clyde-Floyd complex, 1 to 4 percent slopes | M518B | 15 | 1711642 | 1vg38 | mn049 | 2007 | 1:12000 |
Clyde silty clay loam, 0 to 3 percent slopes | 88 | 42005 | 400486 | 2shby | mn099 | 1986 | 1:15840 |
Clyde silty clay loam, 0 to 3 percent slopes | M517A | 9260 | 3176273 | 2shby | mn109 | 1977 | 1:15840 |
Clyde silt loam, 0 to 3 percent slopes | 819A | 1675 | 1697337 | 1tz6t | wi093 | 2006 | 1:12000 |
Clyde silt loam, 0 to 3 percent slopes | 819A | 3251 | 422125 | g57y | wi109 | 1975 | 1:15840 |