| Chilcott-Catchell-Chardoton complex, 0 to 4 percent slopes | 4105 | 32819 | 2519229 | 2prhq | id001 | 2012 | 1:24000 |
Catchell-Chilcott-Banbury complex, 1 to 12 percent slopes | 4104 | 16953 | 2519228 | 2prhp | id001 | 2012 | 1:24000 |
Chilcott-Sebree complex, 2 to 4 percent slopes | 35 | 13648 | 2496659 | 2q9m | id001 | 2012 | 1:24000 |
Chilcott-Sebree complex, 0 to 2 percent slopes | 34 | 12483 | 2496658 | 2q9l | id001 | 2012 | 1:24000 |
Chilcott-Sebree complex, bedrock substratum, 2 to 4 percent slopes | 38 | 9336 | 2519012 | 2q9q | id001 | 2012 | 1:24000 |
Elfkin-Chilcott-Power complex, 0 to 4 percent slopes | 4114 | 8079 | 2519237 | 2prhz | id001 | 2012 | 1:24000 |
Chilcott-Purdam-Bowns complex, 0 to 8 percent slopes | 4102 | 6712 | 2519226 | 2prhm | id001 | 2012 | 1:24000 |
Chilcott-Brent silt loams, 0 to 2 percent slopes | 32 | 6215 | 2496656 | 2q9j | id001 | 2012 | 1:24000 |
Chilcott silt loam, bedrock substratum, 2 to 4 percent slopes | 31 | 6156 | 2496655 | 2q9h | id001 | 2012 | 1:24000 |
Chilcott-Sebree complex, bedrock substratum, 0 to 2 percent slopes | 37 | 5307 | 2519011 | 2q9p | id001 | 2012 | 1:24000 |
Chilcott-Chardoton complex, 0 to 4 percent slopes | 4109 | 4330 | 2519233 | 2prhv | id001 | 2012 | 1:24000 |
Chilcott silt loam, bedrock substratum, 0 to 2 percent slopes | 30 | 1852 | 2496654 | 2q9g | id001 | 2012 | 1:24000 |
Chilcott-Sebree complex, 4 to 8 percent slopes | 36 | 1249 | 2496660 | 2q9n | id001 | 2012 | 1:24000 |
Chilcott-Aldape complex, 3 to 12 percent slopes | 2363 | 480 | 2519173 | 217wb | id001 | 2012 | 1:24000 |
Chilcott-Brent complex, 2 to 8 percent slopes | 33 | 445 | 2496657 | 2q9k | id001 | 2012 | 1:24000 |
Chilcott-Sebree complex, bedrock substratum, 4 to 8 percent slopes | 39 | 250 | 2519013 | 2q9r | id001 | 2012 | 1:24000 |
Chilcott-Vickery silt loams, 4 to 12 percent slopes | 33 | 602 | 81226 | 2qj6 | id656 | 1992 | 1:24000 |
Elijah-Chilcott silt loams, 3 to 7 percent slopes | EcC | 11222 | 81313 | 2qm0 | id659 | 1971 | 1:20000 |
Elijah-Vickery silt loams, 1 to 3 percent slopes | EeB | 2308 | 81314 | 2qm1 | id659 | 1971 | 1:20000 |
Chilcott-Vickery complex, 0 to 12 percent slopes | CrC | 9634 | 80520 | 2psf | id660 | 1962 | 1:15840 |
Lanktree and Chilcott loams, 7 to 12 percent slopes | LmD | 5915 | 80596 | 2pvw | id660 | 1962 | 1:15840 |
Lanktree and Chilcott loams, 12 to 30 percent slopes | LmE | 3153 | 80597 | 2pvx | id660 | 1962 | 1:15840 |
Lanktree and Chilcott loams, 3 to 7 percent slopes | LmC | 941 | 80595 | 2pvv | id660 | 1962 | 1:15840 |
Lanktree and Chilcott sandy loams, 12 to 30 percent slopes | LnE | 624 | 80598 | 2pvy | id660 | 1962 | 1:15840 |
Lanktree, Chilcott, and Sebree loams, 1 to 3 percent slopes | LoB | 75 | 80599 | 2pvz | id660 | 1962 | 1:15840 |
Elijah-Chilcott silt loams, 1 to 3 percent slopes | EsB | 9500 | 80750 | 2q0v | id665 | 1967 | 1:20000 |
Elijah-Chilcott silt loams, 0 to 1 percent slopes | EsA | 980 | 80749 | 2q0t | id665 | 1967 | 1:20000 |
Arbidge-Buncelvoir-Chilcott complex, 2 to 6 percent slopes | 4 | 45707 | 486186 | j9xf | id675 | 1992 | 1:24000 |
Arbidge-Chilcott silt loams, 1 to 8 percent slopes | 5 | 29318 | 486208 | j9y4 | id675 | 1992 | 1:24000 |
Chilcott-Lamonta complex, 2 to 12 percent slopes | 38 | 9352 | 486182 | j9x9 | id675 | 1992 | 1:24000 |
Chilcott-Igert gravelly loams, 2 to 20 percent slopes | 37 | 5942 | 486181 | j9x8 | id675 | 1992 | 1:24000 |
Chilcott-Catchell-Power complex, 1 to 6 percent slopes | 34 | 19460 | 81968 | 2r94 | id681 | 1993 | 1:24000 |
McHandy-Catchell-Chilcott complex, 1 to 8 percent slopes | 118 | 16565 | 81846 | 2r56 | id681 | 1993 | 1:24000 |
Chilcott-Linkletter complex, 2 to 25 percent slopes | 35 | 9690 | 81969 | 2r95 | id681 | 1993 | 1:24000 |
Chilcott-Elijah silt loams, 0 to 12 percent slopes | 27 | 44441 | 2519548 | 2qzw | id685 | 2012 | 1:24000 |
Lanktree-Chilcott loams, 0 to 12 percent slopes | 94 | 29766 | 2519622 | 2r28 | id685 | 2012 | 1:24000 |
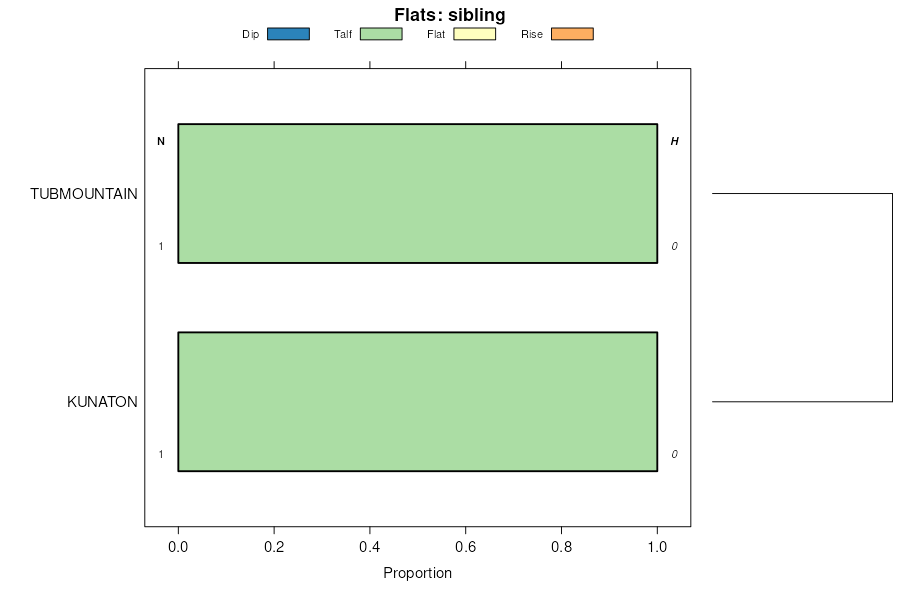
Kunaton-Chilcott silt loams, 2 to 12 percent slopes | 89 | 20983 | 2519616 | 2r22 | id685 | 2012 | 1:24000 |
Chilcott-Kunaton-Chardoton complex, 2 to 12 percent slopes | 28 | 11930 | 2519549 | 2qzx | id685 | 2012 | 1:24000 |
Trosi-Chilcott-Tenmile gravelly loams, 2 to 20 percent slopes | 160 | 11677 | 2519521 | 2qz0 | id685 | 2012 | 1:24000 |
Colthorp-Chilcott silt loams, 0 to 8 percent slopes | 32 | 9528 | 2519554 | 2r02 | id685 | 2012 | 1:24000 |
Chilcott-Power complex, 0 to 8 percent slopes | 29 | 8376 | 2519550 | 2qzy | id685 | 2012 | 1:24000 |
Chilcott silt loam, 0 to 4 percent slopes | 24 | 8359 | 2519545 | 2qzs | id685 | 2012 | 1:24000 |
Chilcott silty clay loam, 0 to 12 percent slopes, extremely stony | 25 | 7649 | 2519546 | 2qzt | id685 | 2012 | 1:24000 |
Chilcott-Day-Rock outcrop complex, 2 to 15 percent slopes | 26 | 3714 | 2519547 | 2qzv | id685 | 2012 | 1:24000 |
Elfkin-Chilcott-Power complex, 0 to 4 percent slopes | 4114 | 449 | 2519646 | 2prhz | id685 | 2012 | 1:24000 |
Chilcott-Purdam-Bowns complex, 0 to 8 percent slopes | 4102 | 118 | 2519643 | 2prhm | id685 | 2012 | 1:24000 |
Chilcott silt loam, 2 to 5 percent slopes | 5B | 276 | 62854 | 23dk | or641 | 1975 | 1:20000 |
Chilcott silt loam, 5 to 12 percent slopes | 5C | 115 | 62855 | 23dl | or641 | 1975 | 1:20000 |
Linkletter-Tubmountain-Chilcott complex, 2 to 15 percent slopes | 2935 | 24381 | 2425725 | 2mf56 | or645 | | 1:24000 |
Chilcott-Cherry Spring complex, 2 to 10 percent slopes | 7025 | 10994 | 2722260 | 2sf2y | or645 | | 1:24000 |
Hardtrigger-Chilcott-Puls complex, 2 to 25 percent slopes | 5034 | 10100 | 2946834 | 2wmbj | or645 | | 1:24000 |
Chilcott loam, 2 to 15 percent slopes | 2941 | 8400 | 2482208 | 2p9y7 | or645 | | 1:24000 |
Chilcott loam, moist, 2 to 5 percent slopes | 2947 | 4457 | 2482023 | 2p9r8 | or645 | | 1:24000 |
Chilcott loam, cool, 1 to 6 percent slopes | 7011 | 2088 | 2504643 | 2q3xx | or645 | | 1:24000 |
Chilcott-Ridenbaugh complex, 1 to 4 percent slopes | 5010 | 538 | 2564831 | 2qxxc | or645 | | 1:24000 |
Farmell-Chilcott complex, 4 to 40 percent slopes | 7019 | 534 | 2504646 | 2q3y0 | or645 | | 1:24000 |