| Catoctin channery loam, 8 to 15 percent slopes | CaC | 2170 | 2495771 | 2ptj7 | md013 | 2010 | 1:12000 |
Catoctin channery loam, 15 to 25 percent slopes | CaD | 1148 | 2495772 | 2ptj8 | md013 | 2010 | 1:12000 |
Catoctin channery loam, 3 to 8 percent slopes | CaB | 315 | 2495770 | 2ptj6 | md013 | 2010 | 1:12000 |
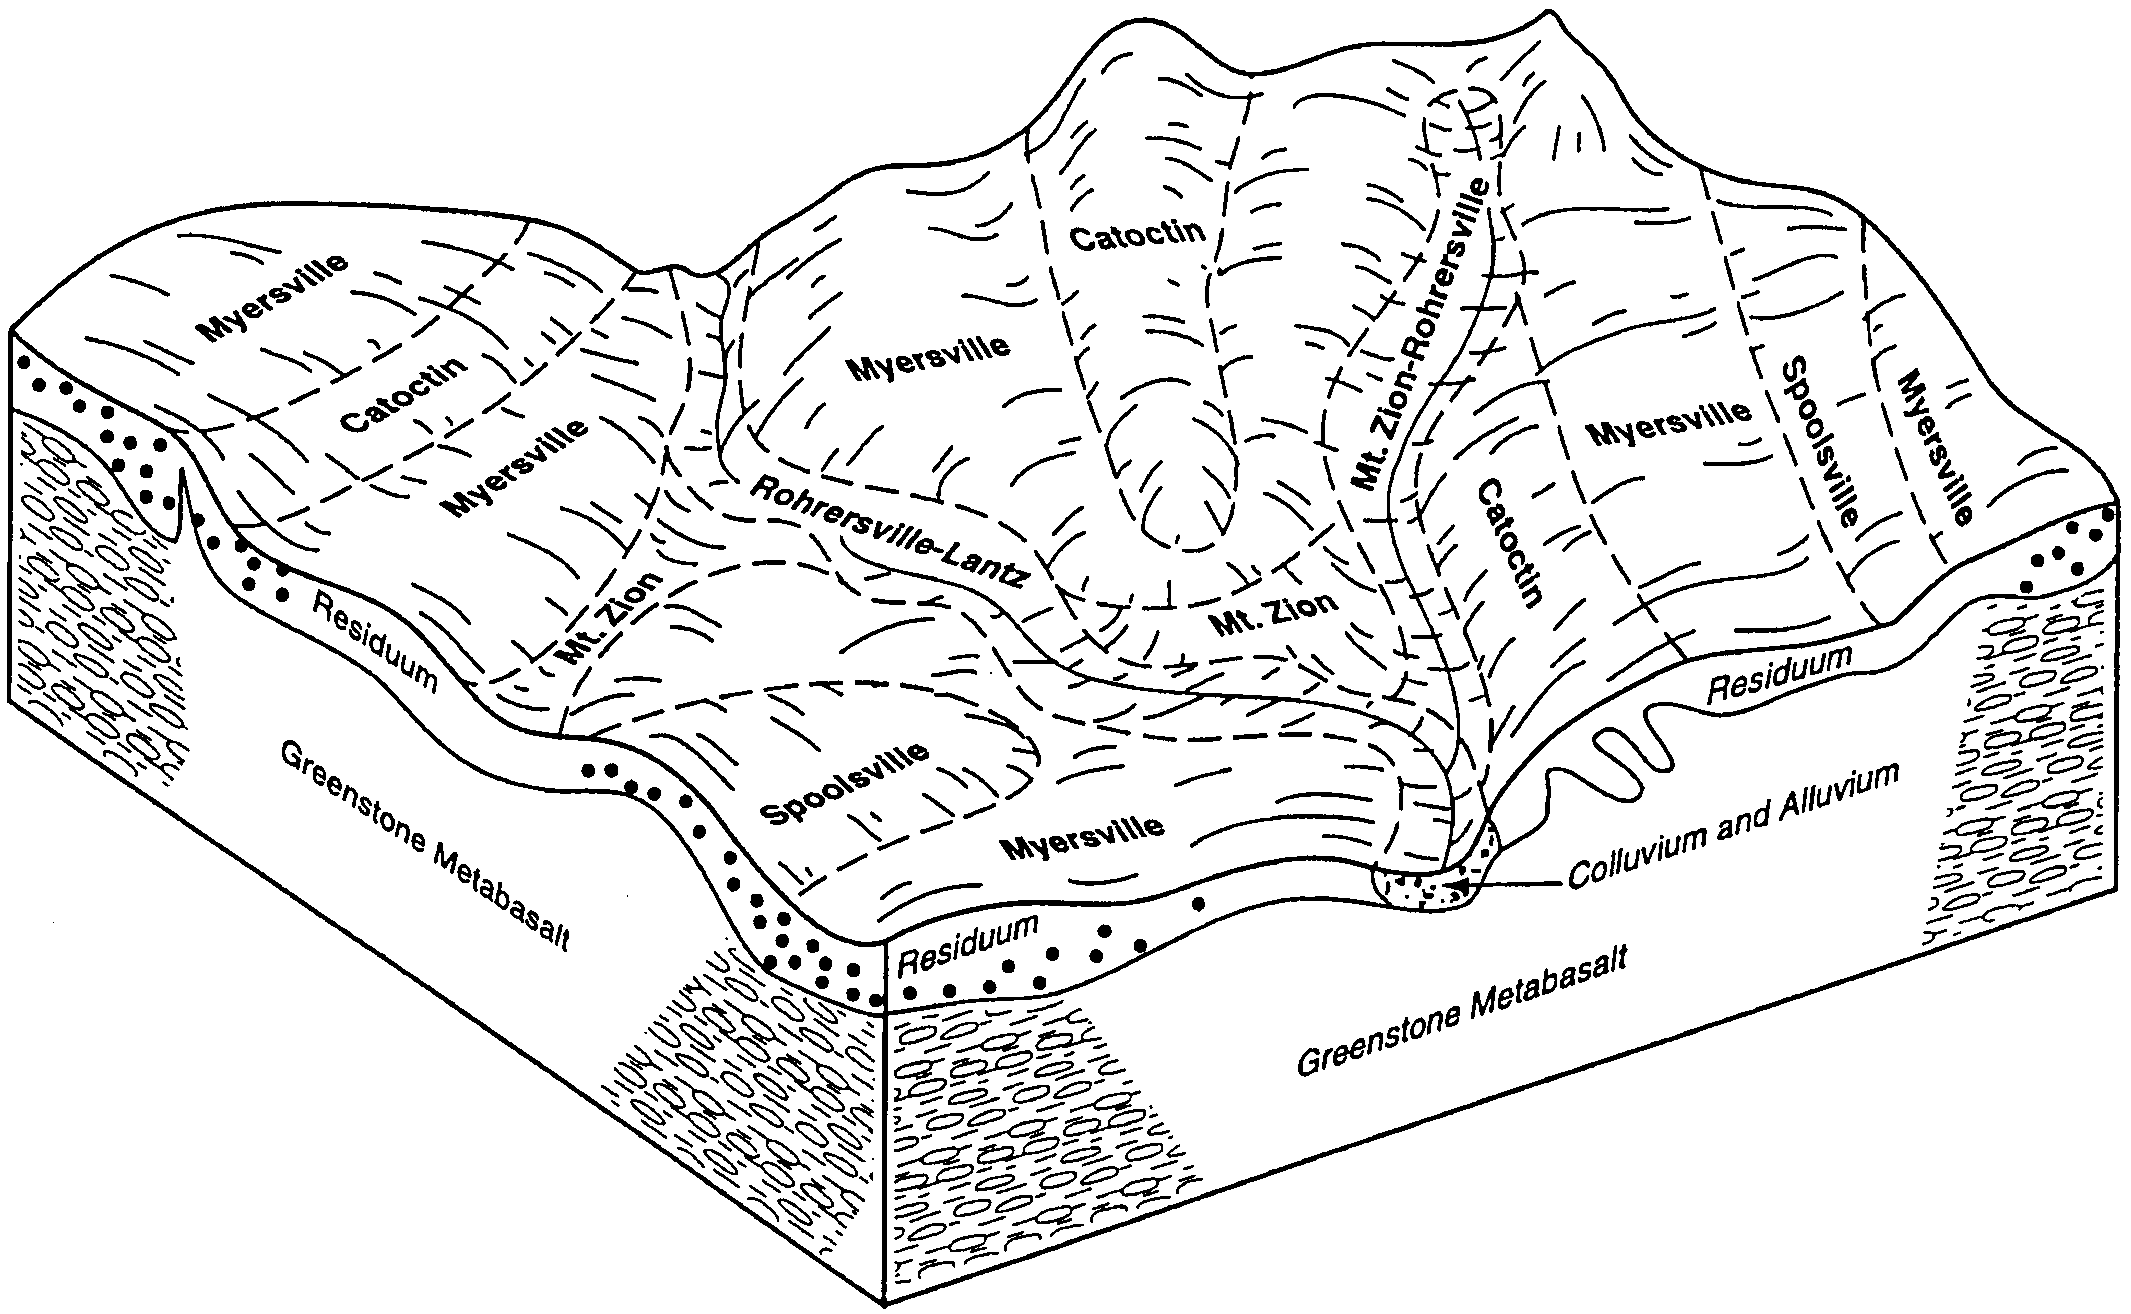
Catoctin-Spoolsville complex, 15 to 25 percent slopes | CeD | 4911 | 534788 | kyh7 | md021 | 2001 | 1:12000 |
Spoolsville-Catoctin complex, 8 to 15 percent slopes | SdC | 4105 | 534869 | kykv | md021 | 2001 | 1:12000 |
Catoctin-Highfield complex, 25 to 45 percent slopes, very rocky | CdE | 1999 | 559033 | lrqb | md021 | 2001 | 1:12000 |
Catoctin-Spoolsville complex, 8 to 15 percent slopes | CeC | 1978 | 534941 | kyn5 | md021 | 2001 | 1:12000 |
Catoctin-Spoolsville complex, 3 to 8 percent slopes | CeB | 1893 | 534940 | kyn4 | md021 | 2001 | 1:12000 |
Catoctin-Highfield complex, 8 to 15 percent slopes, very rocky | CdC | 1867 | 534938 | kyn2 | md021 | 2001 | 1:12000 |
Catoctin-Highfield complex, 3 to 8 percent slopes, very rocky | CdB | 1104 | 534937 | kyn1 | md021 | 2001 | 1:12000 |
Catoctin-Spoolsville complex, 25 to 45 percent slopes | CeE | 1101 | 534789 | kyh8 | md021 | 2001 | 1:12000 |
Catoctin channery loam, 15 to 25 percent slopes | CcD | 836 | 534935 | kymz | md021 | 2001 | 1:12000 |
Catoctin-Highfield complex, 15 to 25 percent slopes, very rocky | CdD | 759 | 534939 | kyn3 | md021 | 2001 | 1:12000 |
Catoctin channery loam, 25 to 45 percent slopes | CcE | 514 | 534936 | kyn0 | md021 | 2001 | 1:12000 |
Myersville-Catoctin-Urban land complex, 3 to 8 percent slopes | MyB | 508 | 535048 | kyrm | md021 | 2001 | 1:12000 |
Catoctin channery loam, 8 to 15 percent slopes | CcC | 494 | 534934 | kymy | md021 | 2001 | 1:12000 |
Myersville-Catoctin-Urban land complex, 8 to 15 percent slopes | MyC | 329 | 535049 | kyrn | md021 | 2001 | 1:12000 |
Catoctin-Myersville channery loams, 8 to 15 percent slopes | CcC | 691 | 534195 | kxw3 | md043 | 1998 | 1:12000 |
Catoctin-Myersville channery loams, 3 to 8 percent slopes | CcB | 612 | 534192 | kxw0 | md043 | 1998 | 1:12000 |
Catoctin-Myersville channery loams, 15 to 25 percent slopes | CcD | 330 | 534198 | kxw6 | md043 | 1998 | 1:12000 |
Highfield and Catoctin channery silt loams, 25 to 70 percent slopes, very stony | HMF | 9306 | 545593 | l9qs | pa001 | 1991 | 1:24000 |
Highfield, Catoctin, and Myersville soils, 8 to 25 percent slopes, very stony | HKD | 8302 | 545592 | l9qr | pa001 | 1991 | 1:24000 |
Highfield and Catoctin channery silt loams, 15 to 25 percent slopes | HHD | 4641 | 545590 | l9qp | pa001 | 1991 | 1:24000 |
Highfield, Catoctin, and Myersville soils, 0 to 8 percent slopes, very stony | HKB | 1902 | 545591 | l9qq | pa001 | 1991 | 1:24000 |
Catoctin channery silt loam, 8 to 15 percent slopes | CcC | 778 | 545566 | l9px | pa001 | 1991 | 1:24000 |
Catoctin channery silt loam, 25 to 35 percent slopes | CcE | 617 | 545567 | l9py | pa001 | 1991 | 1:24000 |
Catoctin channery silt loam, 3 to 8 percent slopes | CcB | 129 | 545565 | l9pw | pa001 | 1991 | 1:24000 |
Catoctin channery silt loam, 8 to 15 percent slopes | CcC | 649 | 693703 | r8vj | pa041 | 1980 | 1:15840 |
Highfield and Catoctin channery silt loams, 3 to 8 percent slopes | HSB | 1143 | 545126 | l97q | pa055 | 1999 | 1:24000 |
Highfield and Catoctin channery silt loams, 8 to 25 percent slopes, extremely stony | HTD | 790 | 545130 | l97v | pa055 | 1999 | 1:24000 |
Highfield and Catoctin channery silt loams, 25 to 50 percent slopes, extremely stony | HTF | 554 | 545131 | l97w | pa055 | 1999 | 1:24000 |
Highfield and Catoctin channery silt loams, 0 to 8 percent slopes, extremely stony | HTB | 349 | 545129 | l97t | pa055 | 1999 | 1:24000 |
Highfield and Catoctin channery silt loams, 8 to 15 percent slopes | HSC | 345 | 545127 | l97r | pa055 | 1999 | 1:24000 |
Highfield and Catoctin channery silt loams, 15 to 25 percent slopes | HSD | 69 | 545128 | l97s | pa055 | 1999 | 1:24000 |
Highfield, Catoctin, and Myersville soils, 8 to 25 percent slopes, very stony | HKD | 490 | 542860 | l6wm | pa133 | 1990 | 1:24000 |
Highfield and Catoctin channery silt loams, 15 to 25 percent slopes | HHD | 208 | 542859 | l6wl | pa133 | 1990 | 1:24000 |
Catoctin channery silt loam, 8 to 15 percent slopes | CcC | 73 | 542824 | l6vg | pa133 | 1990 | 1:24000 |
Myersville-Catoctin very stony silt loams, 25 to 60 percent slopes | 60E | 16060 | 516428 | kbcz | va003 | 1981 | 1:15840 |
Myersville-Catoctin very stony silt loams, 15 to 25 percent slopes | 60D | 3560 | 516427 | kbcy | va003 | 1981 | 1:15840 |
Catoctin silt loam, 25 to 45 percent slopes, very stony | 13E | 2860 | 516304 | 2xxxm | va003 | 1981 | 1:15840 |
Myersville-Catoctin very stony silt loams, 7 to 15 percent slopes | 60C | 1850 | 516426 | kbcx | va003 | 1981 | 1:15840 |
Catoctin silt loam, 15 to 25 percent slopes | 12D | 1370 | 516300 | 2yfhj | va003 | 1981 | 1:15840 |
Catoctin silt loam, 25 to 45 percent slopes | 12E | 1320 | 516301 | 2xxxj | va003 | 1981 | 1:15840 |
Catoctin silt loam, 15 to 25 percent slopes, very stony | 13D | 950 | 516303 | 2xxxl | va003 | 1981 | 1:15840 |
Catoctin silt loam, 7 to 15 percent slopes | 12C | 720 | 516299 | 2xxxk | va003 | 1981 | 1:15840 |
Catoctin silt loam, 7 to 15 percent slopes, very stony | 13C | 550 | 516302 | 2xxxn | va003 | 1981 | 1:15840 |
Myersville-Catoctin complex, 15 to 35 percent slopes, extremely stony | 24D | 776 | 136675 | 4l6w | va009 | 2004 | 1:24000 |
Myersville-Catoctin complex, 35 to 55 percent slopes, extremely stony | 24E | 626 | 136676 | 4l6x | va009 | 2004 | 1:24000 |
Catoctin-Rock outcrop complex, 25 to 75 percent slopes | 3E | 491 | 136680 | 4l71 | va009 | 2004 | 1:24000 |
Myersville-Catoctin complex, 7 to 15 percent slopes, extremely stony | 24C | 193 | 136678 | 4l6z | va009 | 2004 | 1:24000 |
Catoctin-Rock outcrop complex, 15 to 25 percent slopes | 3D | 125 | 136679 | 4l70 | va009 | 2004 | 1:24000 |
Catoctin-Rock outcrop complex, 7 to 15 percent slopes | 3C | 122 | 136681 | 4l72 | va009 | 2004 | 1:24000 |
Myersville-Catoctin complex, 55 to 75 percent slopes, extremely stony | 24F | 48 | 136677 | 4l6y | va009 | 2004 | 1:24000 |
Catoctin-Myersville very stony silt loams, 15 to 45 percent slopes | 9D | 2870 | 516586 | kbk2 | va043 | 1980 | 1:15840 |
Myersville-Catoctin very stony silt loams, 8 to 15 percent slopes | 29C | 2028 | 516536 | kbhg | va043 | 1980 | 1:15840 |
Myersville-Catoctin silt loams, 8 to 15 percent slopes | 28C | 325 | 516535 | kbhf | va043 | 1980 | 1:15840 |
Rock outcrop-Catoctin complex, 3 to 45 percent slopes | 41C | 224 | 516559 | kbj6 | va043 | 1980 | 1:15840 |
Myersville-Catoctin silt loams, 3 to 8 percent slopes | 28B | 211 | 516534 | kbhd | va043 | 1980 | 1:15840 |
Catoctin-Myersville complex, 15 to 45 percent slopes | 8D | 186 | 516585 | kbk1 | va043 | 1980 | 1:15840 |
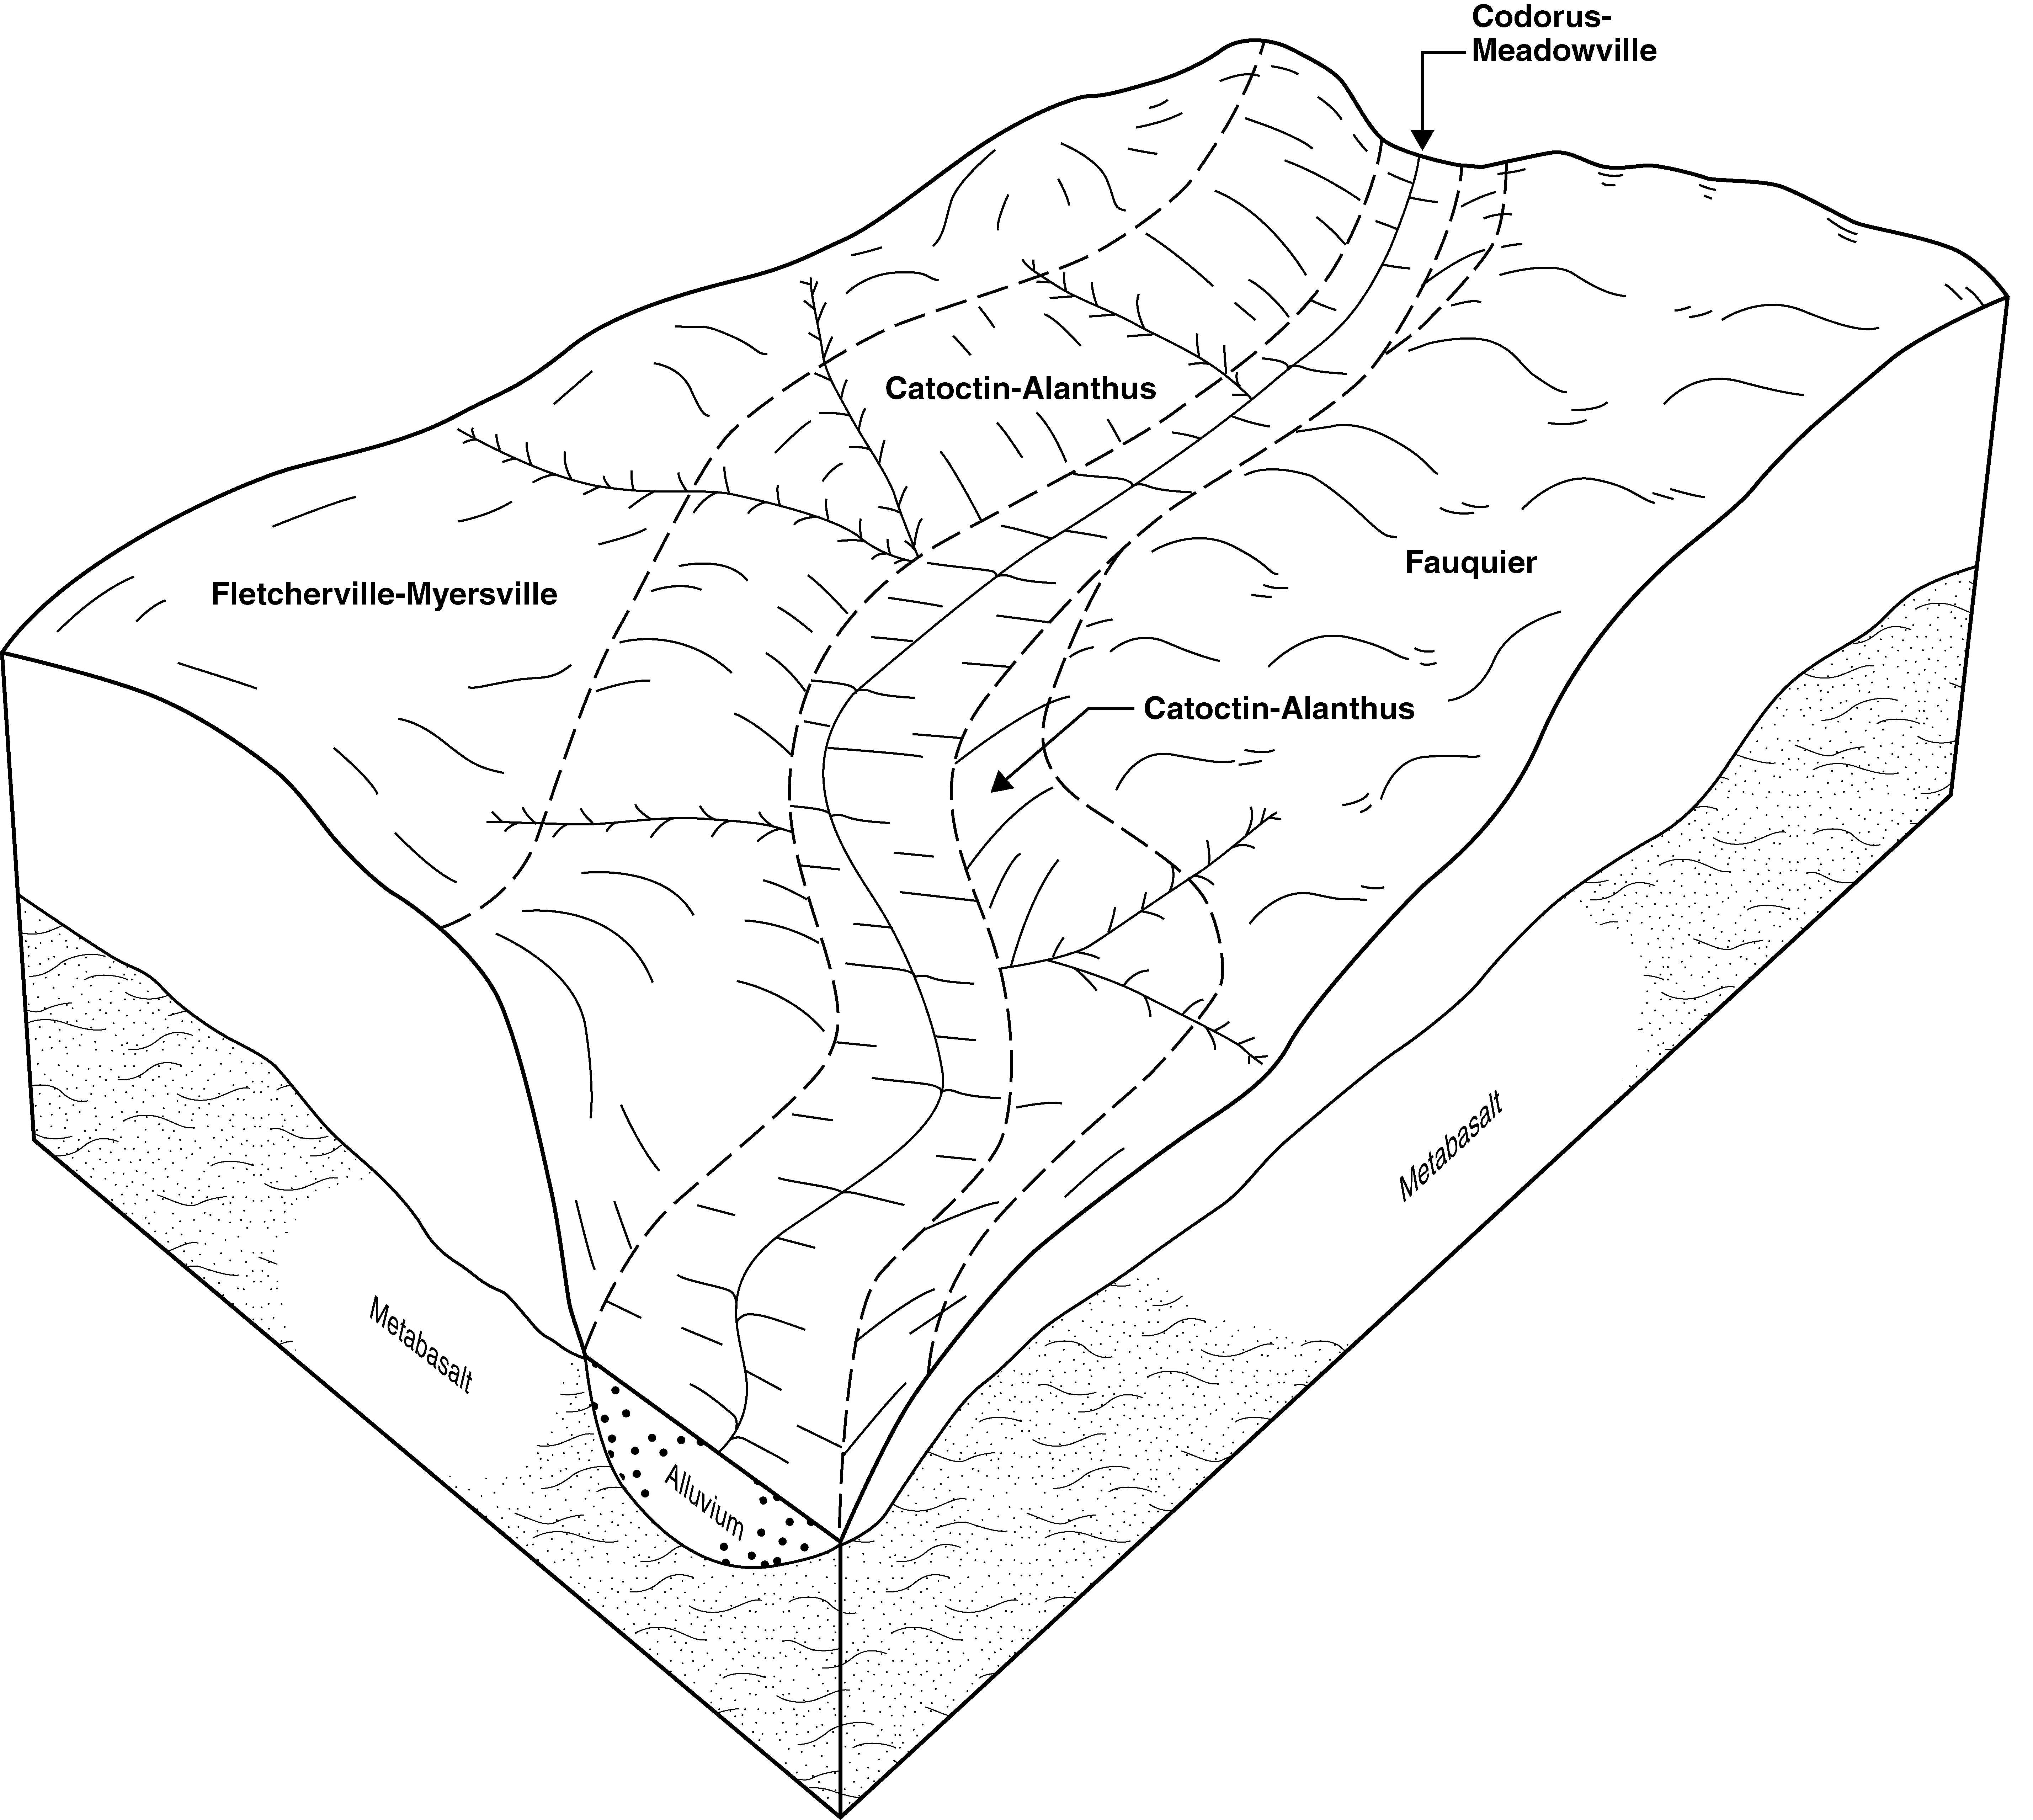
Catoctin-Alanthus complex, 15 to 25 percent slopes | 6D | 2063 | 1726181 | 1vy78 | va047 | 2006 | 1:24000 |
Catoctin-Alanthus complex, 7 to 15 percent slopes | 6C | 2035 | 1726180 | 1vy77 | va047 | 2006 | 1:24000 |
Catoctin-Fletcherville complex, 2 to 7 percent slopes | 5B | 769 | 1726179 | 1vy76 | va047 | 2006 | 1:24000 |
Catoctin-Alanthus-Rock outcrop complex, 25 to 45 percent slopes | 7E | 566 | 1726182 | 1vy79 | va047 | 2006 | 1:24000 |
Myersville and Catoctin extremely stony silt loams, 25 to 80 percent slopes | MyE | 6993 | 516904 | kbwb | va079 | 1983 | 1:15840 |
Myersville and Catoctin extremely stony silt loams, 15 to 25 percent slopes | MyD | 3165 | 516903 | kbw9 | va079 | 1983 | 1:15840 |
Catoctin-Rock outcrop complex, 25 to 80 percent slopes | CcE | 1673 | 516877 | kbvg | va079 | 1983 | 1:15840 |
Myersville and Catoctin very stony silt loams, 7 to 15 percent slopes | MxC | 1042 | 516902 | kbw8 | va079 | 1983 | 1:15840 |
Catoctin channery silt loam, 15 to 25 percent slopes | 40D | 11746 | 642049 | pk38 | va107 | 2006 | 1:12000 |
Myersville-Catoctin complex, 7 to 15 percent slopes | 43C | 8377 | 642052 | pk3c | va107 | 2006 | 1:12000 |
Catoctin channery silt loam, 25 to 45 percent slopes | 40E | 5408 | 642050 | pk39 | va107 | 2006 | 1:12000 |
Myersville-Catoctin complex, 2 to 7 percent slopes | 43B | 5101 | 642051 | pk3b | va107 | 2006 | 1:12000 |
Catoctin channery silt loam, 7 to 15 percent slopes | 40C | 2809 | 642048 | pk37 | va107 | 2006 | 1:12000 |
Myersville-Catoctin very stony silt loams, 7 to 15 percent slopes | MyC | 1216 | 517031 | kc0f | va113 | 1967 | 1:15840 |
Myersville-Catoctin very stony silt loam, 25 to 45 percent slopes | MyE | 1043 | 517033 | kc0h | va113 | 1967 | 1:15840 |
Myersville-Catoctin very stony silt loams, 15 to 25 percent slopes | MyD | 1017 | 517032 | kc0g | va113 | 1967 | 1:15840 |
Catoctin silt loam, 15 to 45 percent slopes | CcE | 603 | 516942 | kbxk | va113 | 1967 | 1:15840 |
Catoctin silt loam, 7 to 15 percent slopes | CcC | 379 | 516941 | kbxj | va113 | 1967 | 1:15840 |
Myersville-Catoctin complex, 35 to 55 percent slopes, extremely stony | 33E | 5596 | 137050 | 4llz | va125 | 1992 | 1:24000 |
Myersville-Catoctin complex, 15 to 35 percent slopes, extremely stony | 33D | 2659 | 137049 | 4lly | va125 | 1992 | 1:24000 |
Catoctin-Rock outcrop complex, 25 to 75 percent slopes, extremely stony | 6E | 1829 | 137158 | 4lqg | va125 | 1992 | 1:24000 |
Myersville-Catoctin complex, 7 to 15 percent slopes, extremely stony | 33C | 945 | 137047 | 4llw | va125 | 1992 | 1:24000 |
Catoctin channery silt loam, 5 to 15 percent slopes | CcC | 442 | 119800 | 2z1w6 | va137 | 1966 | 1:15840 |
Catoctin channery silt loam, 15 to 25 percent slopes | CcD | 395 | 119801 | 2z1w7 | va137 | 1966 | 1:15840 |
Catoctin channery silt loam, 10 to 25 percent slopes, stony | CdD | 238 | 119802 | 2z1w8 | va137 | 1966 | 1:15840 |
Catoctin channery silt loam, 25 to 45 percent slopes, stony | CdE | 207 | 119803 | 2z1w9 | va137 | 1966 | 1:15840 |
Myersville-Catoctin complex 15 to 35 percent slopes, very stony | 34D | 7630 | 517251 | kc7j | va139 | 1995 | 1:20000 |
Myersville-Catoctin complex, 35 to 55 percent slopes, extremely stony | 35E | 2550 | 517257 | kc7q | va139 | 1995 | 1:20000 |
Myersville-Catoctin complex, 35 to 55 percent slopes, very stony | 34E | 2252 | 517252 | kc7k | va139 | 1995 | 1:20000 |
Catoctin silt loam, 15 to 35 percent slopes | 7D | 1831 | 517369 | kccb | va139 | 1995 | 1:20000 |
Catoctin-Rock outcrop complex, 55 to 70 percent slopes, extremely stony | 8F | 812 | 517375 | kccj | va139 | 1995 | 1:20000 |
Myersville-Catoctin complex, 2 to 15 percent slope, very stony | 34C | 758 | 517250 | kc7h | va139 | 1995 | 1:20000 |
Catoctin silt loam, 7 to 15 percent slopes | 7C | 699 | 517368 | kcc9 | va139 | 1995 | 1:20000 |
Myersville-Catoctin complex, 15 to 35 percent slopes, extremely stony | 35D | 359 | 517255 | kc7n | va139 | 1995 | 1:20000 |
Catoctin stony silt loam, steep phase | CaE | 192 | 517411 | kcdp | va157 | 1958 | 1:20000 |
Myersville-Catoctin silt loams, 25 to 65 percent slopes, very stony | 31E | 8125 | 518844 | kdwx | va187 | 1980 | 1:15840 |
Myersville-Catoctin silt loams, 15 to 25 percent slopes, very stony | 31D | 1577 | 518843 | kdww | va187 | 1980 | 1:15840 |
Myersville-Catoctin silt loams, 7 to 15 percent slopes, very stony | 31C | 778 | 518842 | kdwv | va187 | 1980 | 1:15840 |
Catoctin - Urban land complex, 15 to 25 percent slopes | 112D | 61 | 2556831 | 2r7b8 | va540 | 2011 | 1:24000 |
Catoctin silt loam, 7 to 15 percent slopes, very stony | 13C | 11 | 2514320 | 2xxxn | va540 | 2011 | 1:24000 |
Catoctin silt loam, 25 to 45 percent slopes | 12E | 10 | 2496424 | 2xxxj | va540 | 2011 | 1:24000 |
Catoctin silt loam, 25 to 45 percent slopes, very stony | 13E | 4 | 2496425 | 2xxxm | va540 | 2011 | 1:24000 |
Myersville-Catoctin gravelly silt loams, 3 to 15 percent slopes, extremely stony | MxC | 134 | 1710283 | 1vdpf | wv037 | | 1:24000 |
Myersville-Catoctin gravelly silt loams, 15 to 25 percent slopes, extremely stony | MxD | 77 | 1710284 | 1vdpg | wv037 | | 1:24000 |