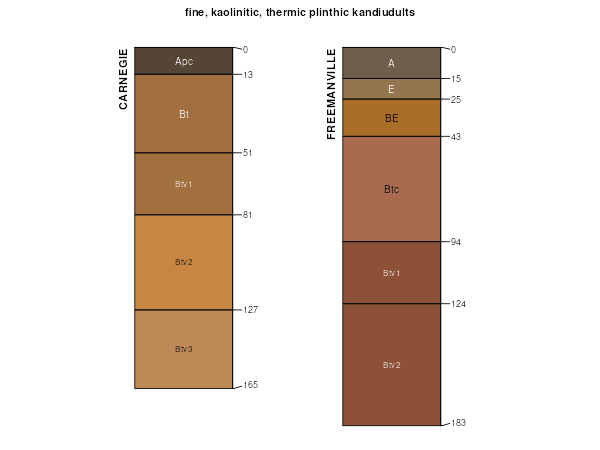
| Carnegie very fine sandy loam, 2 to 5 percent slopes | CgB | 7739 | 328115 | c0fc | al003 | 1961 | 1:20000 |
Carnegie very fine sandy loam, 5 to 8 percent slopes | CgC | 2774 | 328117 | c0ff | al003 | 1961 | 1:20000 |
Carnegie very fine sandy loam, 2 to 5 percent slopes, eroded | CgB2 | 2761 | 328116 | c0fd | al003 | 1961 | 1:20000 |
Carnegie very fine sandy loam, 5 to 8 percent slopes, eroded | CgC2 | 2543 | 328118 | c0fg | al003 | 1961 | 1:20000 |
Carnegie very fine sandy loam, 0 to 2 percent slopes | CgA | 1853 | 328114 | c0fb | al003 | 1961 | 1:20000 |
Carnegie very fine sandy loam, 8 to 12 percent slopes | CgD | 651 | 328119 | c0fh | al003 | 1961 | 1:20000 |
Carnegie very fine sandy loam, 8 to 12 percent slopes, eroded | CgD2 | 520 | 328120 | c0fj | al003 | 1961 | 1:20000 |
Carnegie fine sandy loam, eroded, very gently sloping | CaB2 | 238 | 328966 | c19t | al045 | 1958 | 1:20000 |
Carnegie loamy sand, 2 to 5 percent slopes | CnB | 1855 | 324521 | 2tbym | ga031 | 1965 | 1:20000 |
Carnegie sandy loam, 5 to 8 percent slopes, moderately eroded | CoC2 | 1825 | 324524 | 2tddf | ga031 | 1965 | 1:20000 |
Carnegie sandy loam, 2 to 5 percent slopes, moderately eroded | CoB2 | 1525 | 324523 | 2tbyn | ga031 | 1965 | 1:20000 |
Carnegie loamy sand, 5 to 8 percent slopes | CnC | 590 | 324522 | bwpg | ga031 | 1965 | 1:20000 |
Carnegie sandy loam, 8 to 12 percent slopes, moderately eroded | CoD2 | 105 | 324525 | 2tbyd | ga031 | 1965 | 1:20000 |
Carnegie sandy loam, 5 to 8 percent slopes, moderately eroded | CaC2 | 2436 | 324569 | 2tddf | ga033 | 1982 | 1:20000 |
Carnegie sandy loam, 3 to 5 percent slopes, moderately eroded | CaB2 | 2100 | 324568 | 2tdq8 | ga033 | 1982 | 1:20000 |
Carnegie gravelly sandy loam, 5 to 8 percent slopes | CaC | 1630 | 754248 | 2wz3f | ga087 | 2001 | 1:24000 |
Carnegie gravelly sandy loam, 2 to 5 percent slopes | CaB | 350 | 754247 | 2wyxg | ga087 | 2001 | 1:24000 |
Carnegie sandy loam, 2 to 5 percent slopes, moderately eroded | CoB2 | 1820 | 324621 | 2tbyn | ga095 | 1965 | 1:20000 |
Carnegie sandy loam, 5 to 8 percent slopes, moderately eroded | CoC2 | 1310 | 324622 | 2tddf | ga095 | 1965 | 1:20000 |
Carnegie sandy loam, 2 to 5 percent slopes, moderately eroded | CaB2 | 5895 | 324756 | 2tbyn | ga107 | 1993 | 1:20000 |
Carnegie sandy loam, 5 to 8 percent slopes, moderately eroded | CaC2 | 5720 | 324757 | 2tddf | ga107 | 1993 | 1:20000 |
Carnegie gravelly sandy loam, 5 to 8 percent slopes | CaC | 7782 | 336602 | 2wz3f | ga131 | 2000 | 1:12000 |
Carnegie gravelly sandy loam, 2 to 5 percent slopes | CaB | 1929 | 336601 | 2wyxg | ga131 | 2000 | 1:12000 |
Carnegie loamy sand, 2 to 5 percent slopes, eroded | CnB2 | 920 | 324793 | bwz6 | ga165 | 1966 | 1:20000 |
Carnegie loamy sand, 5 to 8 percent slopes, eroded | CnC2 | 735 | 324794 | bwz7 | ga165 | 1966 | 1:20000 |
Carnegie sandy loam, 5 to 8 percent slopes, eroded | CoC2 | 1845 | 124918 | 45zm | ga229 | 1965 | 1:20000 |
Carnegie sandy loam, 2 to 5 percent slopes, eroded | CoB2 | 1200 | 124917 | 45zl | ga229 | 1965 | 1:20000 |
Carnegie-Nankin complex, 5 to 8 percent slopes, eroded | CkC2 | 7675 | 581298 | mhwk | ga243 | 2002 | 1:24000 |
Carnegie sandy loam, 2 to 5 percent slopes, moderately eroded | CaB2 | 2170 | 581299 | 2tbyn | ga243 | 2002 | 1:24000 |
Carnegie-Nankin complex, 8 to 15 percent slopes, eroded | CkD2 | 1495 | 581297 | mhwj | ga243 | 2002 | 1:24000 |
Carnegie sandy loam, 5 to 8 percent slopes, moderately eroded | CaC2 | 2914 | 324927 | 2tddf | ga277 | 1979 | 1:20000 |
Carnegie sandy loam, 3 to 5 percent slopes, moderately eroded | CaB2 | 1883 | 324926 | 2tdq8 | ga277 | 1979 | 1:20000 |
Carnegie sandy loam, 5 to 8 percent slopes | CaC | 13765 | 325097 | 2tbyp | ga321 | 1985 | 1:20000 |
Carnegie gravelly sandy loam, 2 to 5 percent slopes | CbB | 5475 | 325099 | 2wyxg | ga321 | 1985 | 1:20000 |
Carnegie sandy loam, 8 to 12 percent slopes | CaD | 420 | 325098 | bx91 | ga321 | 1985 | 1:20000 |
Carnegie loamy sand, 2 to 5 percent slopes | CnB | 4250 | 125124 | 4668 | ga601 | 1969 | 1:20000 |
Carnegie loamy sand, 5 to 8 percent slopes | CnC | 3785 | 125125 | 4669 | ga601 | 1969 | 1:20000 |
Carnegie sandy loam, 3 to 5 percent slopes, eroded | CeB2 | 26350 | 125161 | 467g | ga602 | 1983 | 1:20000 |
Carnegie-Cowarts complex, 5 to 8 percent slopes, eroded | CgC2 | 21695 | 125162 | 467h | ga602 | 1983 | 1:20000 |
Carnegie sandy loam, 5 to 8 percent slopes, moderately eroded | CaC2 | 3975 | 325140 | 2tddf | ga603 | 1981 | 1:20000 |
Carnegie sandy loam, 3 to 5 percent slopes, moderately eroded | CaB2 | 1410 | 325139 | 2tdq8 | ga603 | 1981 | 1:20000 |
Carnegie sandy loam, 5 to 8 percent slopes, moderately eroded | CoC2 | 11347 | 325188 | 2tddf | ga608 | 1965 | 1:20000 |
Carnegie sandy loam, 2 to 5 percent slopes, moderately eroded | CoB2 | 4765 | 325186 | 2tbyn | ga608 | 1965 | 1:20000 |
Carnegie sandy loam, 8 to 12 percent slopes, moderately eroded | CoD2 | 922 | 325189 | 2tbyd | ga608 | 1965 | 1:20000 |
Carnegie sandy loam, 5 to 8 percent slopes | CoC | 507 | 325187 | 2tbyp | ga608 | 1965 | 1:20000 |
Carnegie sandy clay loam, 5 to 8 percent slopes, severely eroded | CkC3 | 435 | 325185 | bxcv | ga608 | 1965 | 1:20000 |
Carnegie sandy loam, 5 to 8 percent slopes, eroded | CoC2 | 3030 | 125341 | 46f8 | ga609 | 1967 | 1:20000 |
Carnegie sandy loam, 2 to 5 percent slopes | CoB | 1180 | 125340 | 46f7 | ga609 | 1967 | 1:20000 |
Carnegie sandy loam, 2 to 5 percent slopes, moderately eroded | CaB2 | 15139 | 325366 | 2tbyn | ga610 | 1992 | 1:20000 |
Carnegie sandy loam, 5 to 8 percent slopes, moderately eroded | CaC2 | 12689 | 325367 | 2tddf | ga610 | 1992 | 1:20000 |
Carnegie sandy loam, 5 to 8 percent slopes, moderately eroded | CaC2 | 13040 | 325417 | 2tddf | ga612 | 1975 | 1:20000 |
Carnegie sandy loam, 2 to 5 percent slopes, moderately eroded | CaB2 | 1995 | 325416 | 2tbyn | ga612 | 1975 | 1:20000 |
Carnegie sandy loam, 5 to 8 percent slopes, moderately eroded | CaC2 | 3370 | 325461 | 2tddf | ga615 | 1981 | 1:20000 |
Carnegie sandy loam, 3 to 5 percent slopes, moderately eroded | CaB2 | 1350 | 325460 | 2tdq8 | ga615 | 1981 | 1:20000 |
Carnegie sandy loam, 8 to 12 percent slopes, moderately eroded | CaD2 | 1290 | 325462 | 2tbyd | ga615 | 1981 | 1:20000 |
Carnegie sandy loam, 5 to 8 percent slopes, moderately eroded | CaC2 | 9645 | 325519 | 2tddf | ga617 | 1976 | 1:20000 |
Carnegie sandy loam, 8 to 12 percent slopes, moderately eroded | CaD2 | 1375 | 325520 | 2tbyd | ga617 | 1976 | 1:20000 |
Carnegie sandy loam, 5 to 8 percent slopes, moderately eroded | CoC2 | 10365 | 325546 | 2tddf | ga627 | 1970 | 1:20000 |
Carnegie sandy loam, 8 to 12 percent slopes, moderately eroded | CoD2 | 810 | 325547 | 2tbyd | ga627 | 1970 | 1:20000 |
Carnegie sandy loam, 5 to 8 percent slopes, moderately eroded | CaC2 | 1196 | 325822 | 2tddf | ga638 | 1987 | 1:20000 |
Carnegie sandy loam, 3 to 5 percent slopes, moderately eroded | CaB2 | 851 | 325821 | 2tdq8 | ga638 | 1987 | 1:20000 |
Carnegie sandy loam, 2 to 5 percent slopes, moderately eroded | CaB2 | 5415 | 325940 | 2tbyn | ga641 | 1986 | 1:20000 |
Carnegie sandy loam, 5 to 8 percent slopes, moderately eroded | CaC2 | 3420 | 325941 | 2tddf | ga641 | 1986 | 1:20000 |
Carnegie sandy loam, 5 to 8 percent slopes, moderately eroded | CoC2 | 15265 | 326048 | 2tddf | ga647 | 1970 | 1:20000 |
Carnegie loamy sand, 2 to 5 percent slopes | CnB | 10650 | 326047 | 2tbym | ga647 | 1970 | 1:20000 |
Carnegie sandy loam, 5 to 8 percent slopes, moderately eroded | CoC2 | 10325 | 326243 | 2tddf | ga652 | 1969 | 1:20000 |
Carnegie sandy loam, 8 to 12 percent slopes, moderately eroded | CoD2 | 6255 | 326244 | 2tbyd | ga652 | 1969 | 1:20000 |
Carnegie sandy loam, 2 to 5 percent slopes, moderately eroded | CoB2 | 1615 | 326242 | 2tbyn | ga652 | 1969 | 1:20000 |
Carnegie-Nankin complex, 5 to 8 percent slopes, eroded | CkC2 | 1300 | 1605071 | 1qw6h | ga658 | 2005 | 1:24000 |
Carnegie-Nankin complex, 8 to 15 percent slopes, eroded | CkD2 | 445 | 1605072 | 1qw6j | ga658 | 2005 | 1:24000 |
Carnegie sandy loam, 2 to 5 percent slopes, eroded | CaB2 | 205 | 1605070 | 1qw6g | ga658 | 2005 | 1:24000 |
