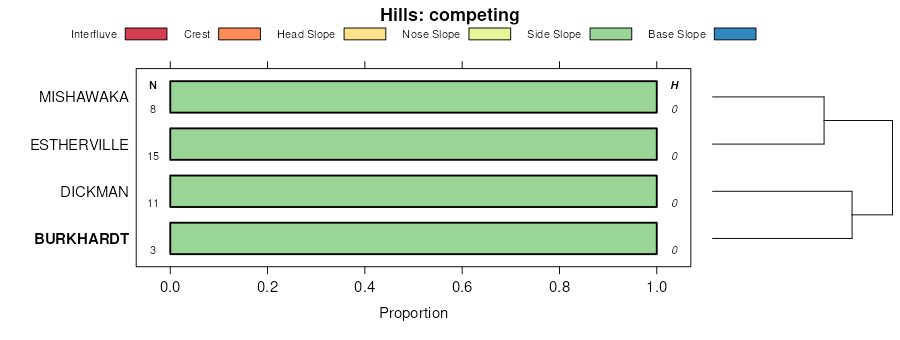
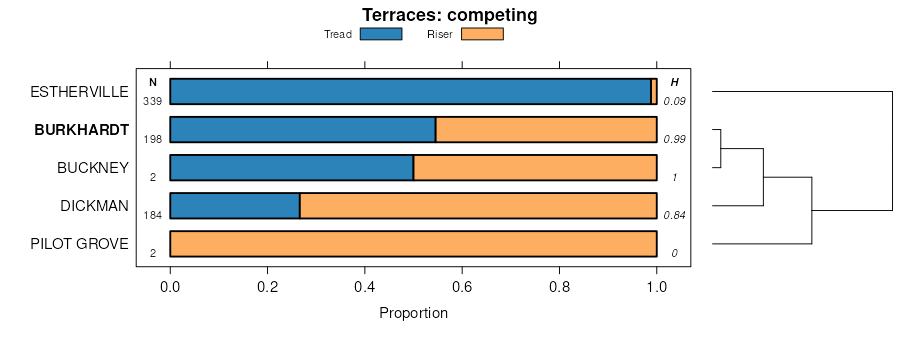
| Burkhardt sandy loam, 2 to 9 percent slopes | 285C | 319 | 402866 | fj6p | ia011 | 1977 | 1:15840 |
Burkhardt-Bassett-Chelsea complex, 18 to 60 percent slopes | 1285G | 345 | 473078 | 30qwj | ia013 | 2001 | 1:12000 |
Burkhardt sandy loam, 0 to 2 percent slopes, rarely flooded | 285 | 418 | 2220245 | 2djbt | ia017 | 2008 | 1:12000 |
Burkhardt sandy loam, 2 to 9 percent slopes, rarely flooded | 285C | 298 | 2220246 | 2djbv | ia017 | 2008 | 1:12000 |
Burkhardt-Saude complex, 2 to 5 percent slopes | 241B | 2266 | 403225 | fjl8 | ia019 | 1978 | 1:15840 |
Saude-Burkhardt complex, 2 to 9 percent slopes, moderately eroded | 241C2 | 1520 | 403384 | fjrd | ia023 | 1978 | 1:15840 |
Burkhardt sandy loam, 2 to 9 percent slopes | 285C | 569 | 403390 | fjrl | ia023 | 1978 | 1:15840 |
Saude-Burkhardt complex, 9 to 18 percent slopes, moderately eroded | 241E2 | 270 | 403385 | fjrf | ia023 | 1978 | 1:15840 |
Burkhardt sandy loam, 2 to 5 percent slopes | 285B | 1586 | 404019 | fkdw | ia037 | 1989 | 1:15840 |
Burkhardt sandy loam, 5 to 14 percent slopes | 285D | 951 | 404022 | fkdz | ia037 | 1989 | 1:15840 |
Burkhardt sandy loam, 0 to 2 percent slopes | 285 | 475 | 404018 | fkdv | ia037 | 1989 | 1:15840 |
Burkhardt sandy loam, 5 to 14 percent slopes | 285D | 483 | 404398 | fkt3 | ia045 | 1978 | 1:15840 |
Burkhardt sandy loam, 14 to 25 percent slopes, moderately erode | 285F2 | 449 | 404399 | fkt4 | ia045 | 1978 | 1:15840 |
Burkhardt sandy loam, 2 to 5 percent slopes | 285B | 141 | 404397 | fkt2 | ia045 | 1978 | 1:15840 |
Burkhardt-Saude complex, 2 to 5 percent slopes | 241B | 2325 | 405029 | flgg | ia055 | 1984 | 1:15840 |
Burkhardt sandy loam, 2 to 5 percent slopes | 285B | 361 | 405032 | flgk | ia055 | 1984 | 1:15840 |
Burkhardt sandy loam, 5 to 14 percent slopes | 285D | 194 | 405414 | flvw | ia061 | 1983 | 1:15840 |
Burkhardt sandy loam, 2 to 5 percent slopes | 285B | 1211 | 405754 | fm6v | ia065 | 1975 | 1:15840 |
Burkhardt sandy loam, 5 to 9 percent slopes, moderately eroded | 285C2 | 967 | 405755 | fm6w | ia065 | 1975 | 1:15840 |
Burkhardt sandy loam, 0 to 2 percent slopes | 285 | 243 | 405753 | fm6t | ia065 | 1975 | 1:15840 |
Burkhardt sandy loam, 9 to 18 percent slopes, moderately eroded | 285E2 | 197 | 405756 | fm6x | ia065 | 1975 | 1:15840 |
Burkhardt sandy loam, 5 to 9 percent slopes | 285C | 817 | 405902 | fmcm | ia067 | 1989 | 1:15840 |
Burkhardt sandy loam, 2 to 5 percent slopes | 285B | 788 | 405901 | fmcl | ia067 | 1989 | 1:15840 |
Burkhardt sandy loam, 14 to 30 percent slopes | 285F | 192 | 405904 | fmcp | ia067 | 1989 | 1:15840 |
Burkhardt sandy loam, 3 to 9 percent slopes | 285C | 569 | 406937 | fng0 | ia089 | 1969 | 1:15840 |
Burkhardt sandy loam, 5 to 9 percent slopes | 285C | 339 | 407990 | fpjz | ia103 | 1979 | 1:15840 |
Burkhardt sandy loam, 9 to 14 percent slopes, moderately eroded | 285D2 | 489 | 408598 | fq5l | ia113 | 1970 | 1:15840 |
Burkhardt sandy loam, 2 to 9 percent slopes | 285C | 306 | 408597 | fq5k | ia113 | 1970 | 1:15840 |
Burkhardt sandy loam, 3 to 9 percent slopes | 285C | 362 | 409660 | fr8v | ia131 | 1971 | 1:15840 |
Burkhardt sandy loam, 0 to 3 percent slopes | 285 | 143 | 409659 | fr8t | ia131 | 1971 | 1:15840 |
Burkhardt loam, 14 to 25 percent slopes | 285F | 842 | 1399089 | 1hyvx | ia191 | 2005 | 1:12000 |
Burkhardt loam, 2 to 5 percent slopes | 285B | 129 | 437382 | gp43 | ia191 | 2005 | 1:12000 |
Burkhardt-Saude complex, 0 to 2 percent slopes | 961A | 765 | 198770 | 6nty | il161 | 2002 | 1:12000 |
Burkhardt sandy loam, 6 to 12 percent slopes | 151C | 1769 | 396781 | f9wd | mn037 | 1980 | 1:15840 |
Burkhardt sandy loam, 12 to 18 percent slopes | 151D | 730 | 396782 | f9wf | mn037 | 1980 | 1:15840 |
Burkhardt sandy loam, very gravelly substratum, 0 to 3 percent slopes | N628A | 1439 | 1690742 | 1trc2 | mn049 | 2007 | 1:12000 |
Burkhardt sandy loam, 0 to 6 percent slopes | N623B | 520 | 1690451 | 1tr1p | mn049 | 2007 | 1:12000 |
Burkhardt loam, 0 to 2 percent slopes | BrA | 1060 | 2216299 | 2dd7j | mn157 | 2008 | 1:12000 |
Burkhardt sandy loam, 0 to 2 percent slopes | BtA | 1053 | 2216301 | 2dd7l | mn157 | 2008 | 1:12000 |
Burkhardt sandy loam, 2 to 6 percent slopes | BtB | 447 | 2216302 | 2dd7m | mn157 | 2008 | 1:12000 |
Burkhardt sandy loam, 6 to 12 percent slopes, moderately eroded | BtC2 | 240 | 2216304 | 2dd7p | mn157 | 2008 | 1:12000 |
Burkhardt loam, 2 to 6 percent slopes | BrB | 176 | 2216300 | 2dd7k | mn157 | 2008 | 1:12000 |
Burkhardt gravelly sandy loam, 2 to 6 percent slopes | BkB | 144 | 2216298 | 2dd7h | mn157 | 2008 | 1:12000 |
Burkhardt gravelly sandy loam, 0 to 2 percent slopes | BkA | 115 | 2216297 | 2dd7g | mn157 | 2008 | 1:12000 |
Burkhardt sandy loam, 0 to 3 percent slopes | 151 | 929 | 1677061 | 1t93r | mn163 | 1978 | 1:15840 |
Burkhardt sandy loam, 3 to 9 percent slopes | 151B | 597 | 1677062 | 1t93s | mn163 | 1978 | 1:15840 |
Burkhardt sandy loam, 0 to 3 percent slopes | 453A | 380 | 2561687 | 1vgbr | wi011 | 1960 | 1:12000 |
Burkhardt sandy loam, 2 to 6 percent slopes | 453B | 346 | 2561688 | 1vgbs | wi011 | 1960 | 1:12000 |
Burkhardt sandy loam, 0 to 3 percent slopes | 453A | 9986 | 421501 | g4lt | wi017 | 1985 | 1:15840 |
Burkhardt sandy loam, 2 to 6 percent slopes | 453B | 1306 | 2518441 | 1vgbs | wi033 | 2003 | 1:12000 |
Burkhardt sandy loam, 0 to 3 percent slopes | 453A | 782 | 2517809 | 1vgbr | wi033 | 2003 | 1:12000 |
Burkhardt sandy loam, 0 to 3 percent slopes | 453A | 225 | 3099714 | 1vgbr | wi035 | 1974 | 1:12000 |
Burkhardt sandy loam, 0 to 3 percent slopes | 453A | 3511 | 2517810 | 1vgbr | wi091 | 1998 | 1:12000 |
Burkhardt sandy loam, 2 to 6 percent slopes | 453B | 382 | 2518442 | 1vgbs | wi091 | 1998 | 1:12000 |
Burkhardt sandy loam, 0 to 3 percent slopes | 453A | 620 | 1691012 | 1trms | wi093 | 2006 | 1:12000 |
Burkhardt sandy loam, 2 to 6 percent slopes | 453B | 257 | 1703737 | 1v5w8 | wi093 | 2006 | 1:12000 |
Burkhardt sandy loam, 2 to 6 percent slopes | 453B | 3241 | 421151 | g47j | wi095 | 1978 | 1:15840 |
Burkhardt sandy loam, 0 to 2 percent slopes | 453A | 2359 | 421150 | g47h | wi095 | 1978 | 1:15840 |
Burkhardt sandy loam, 6 to 12 percent slopes, eroded | 453C2 | 1164 | 421152 | g47k | wi095 | 1978 | 1:15840 |
Burkhardt-Sattre complex, 6 to 12 percent slopes, eroded | 3453C2 | 10977 | 422120 | g57s | wi109 | 1975 | 1:15840 |
Burkhardt-Sattre complex, 12 to 30 percent slopes, eroded | 3453E2 | 8754 | 422121 | g57t | wi109 | 1975 | 1:15840 |
Burkhardt-Sattre complex, 2 to 6 percent slopes | 3453B | 4693 | 422119 | g57r | wi109 | 1975 | 1:15840 |
Burkhardt sandy loam, 6 to 12 percent slopes, eroded | 453C2 | 2388 | 422118 | g57q | wi109 | 1975 | 1:15840 |
Burkhardt sandy loam, 1 to 6 percent slopes | 453B | 2348 | 422117 | g57p | wi109 | 1975 | 1:15840 |