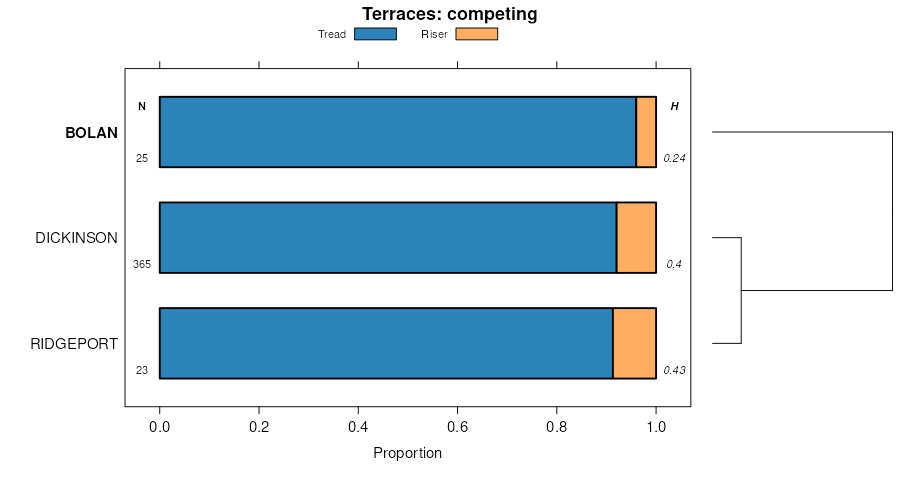
Official Series Description


Lab Data Summary

Aggregate lab data for the BOLAN soil series. This aggregation is based on all pedons with a current taxon name of BOLAN, and applied along 1-cm thick depth slices. Solid lines are the slice-wise median, bounded on either side by the interval defined by the slice-wise 5th and 95th percentiles. The median is the value that splits the data in half. Five percent of the data are less than the 5th percentile, and five percent of the data are greater than the 95th percentile. Values along the right hand side y-axis describe the proportion of pedon data that contribute to aggregate values at this depth. For example, a value of "90%" at 25cm means that 90% of the pedons correlated to BOLAN were used in the calculation. Source: KSSL snapshot . Methods used to assemble the KSSL snapshot used by SoilWeb / SDE

Click the image to view it full size.

Pedons used in the lab summary:

MLRALab IDPedon IDTaxonnameCINSSL / NASIS ReportsLink To SoilWeb GMap
10409N1089S09IA055001Bolan7Primary | Supplementary | Taxonomy | Pedon | Water Retention | Correlation | Andic Soil Properties42.3885384,-91.4717407
10409N1090S09IA067001Bolan7Primary | Supplementary | Taxonomy | Pedon | Water Retention | Correlation | Andic Soil Properties43.1413956,-92.6843719
10409N1091S09IA195001Bolan7Primary | Supplementary | Taxonomy | Pedon | Water Retention | Correlation | Andic Soil Properties43.3145561,-93.1371384
104X28-174-1S1979IA055004Bolan2Primary | Supplementary | Taxonomy | Pedon | Water Retention | Correlation | Andic Soil Properties42.2997191,-91.4157996
104X28-974-1S1980IA055006Bolan2Primary | Supplementary | Taxonomy | Pedon | Water Retention | Correlation | Andic Soil Properties42.5924465,-91.4092218
104X53-174-1S1982IA105119Bolan2Primary | Supplementary | Taxonomy | Pedon | Water Retention | Correlation | Andic Soil Properties42.2869383,-91.1809674

Water Balance

Monthly water balance estimated using a leaky-bucket style model for the BOLAN soil series. Monthly precipitation (PPT) and potential evapotranspiration (PET) have been estimated from the 50th percentile of gridded values (PRISM 1981-2010) overlapping with the extent of SSURGO map units containing each series as a major component. Monthly PET values were estimated using the method of Thornthwaite (1948). These (and other) climatic parameters are calculated with each SSURGO refresh and provided by the fetchOSD function of the soilDB package. Representative water storage values (“AWC” in the figures) were derived from SSURGO by taking the 50th percentile of profile-total water storage (sum[awc_r * horizon thickness]) for each soil series. Note that this representation of “water storage” is based on the average ability of most plants to extract soil water between 15 bar (“permanent wilting point”) and 1/3 bar (“field capacity”) matric potential. Soil moisture state can be roughly interpreted as “dry” when storage is depleted, “moist” when storage is between 0mm and AWC, and “wet” when there is a surplus. Clearly there are a lot of assumptions baked into this kind of monthly water balance. This is still a work in progress.

Click the image to view it full size.


Click the image to view it full size.

Sibling Summary

Siblings are those soil series that occur together in map units, in this case with the BOLAN series. Sketches are arranged according to their subgroup-level taxonomic structure. Source: SSURGO snapshot , parsed OSD records and snapshot of SC database .

Click the image to view it full size.

Select annual climate data summaries for the BOLAN series and siblings. Series are sorted according to hierarchical clustering of median values. Source: SSURGO map unit geometry and 1981-2010, 800m PRISM data .

Click the image to view it full size.

Geomorphic description summaries for the BOLAN series and siblings. Series are sorted according to hierarchical clustering of proportions and relative hydrologic position within an idealized landform (e.g. top to bottom). Most soil series (SSURGO components) are associated with a hillslope position and one or more landform-specific positions: hills, mountain slopes, terraces, and/or flats. Proportions can be interpreted as an aggregate representation of geomorphic membership. The values printed to the left (number of component records) and right (Shannon entropy) of stacked bars can be used to judge the reliability of trends. Small Shannon entropy values suggest relatively consistent geomorphic association, while larger values suggest lack thereof. Source: SSURGO component records .

Click the image to view it full size.

Click the image to view it full size.

There are insufficient data to create the 3D mountains figure.

Click the image to view it full size.

Click the image to view it full size.

Competing Series

Soil series competing with BOLAN share the same family level classification in Soil Taxonomy. Source: parsed OSD records and snapshot of the SC database .

Click the image to view it full size.

Select annual climate data summaries for the BOLAN series and competing. Series are sorted according to hierarchical clustering of median values. Source: SSURGO map unit geometry and 1981-2010, 800m PRISM data .

Click the image to view it full size.

Geomorphic description summaries for the BOLAN series and competing. Series are sorted according to hierarchical clustering of proportions and relative hydrologic position within an idealized landform (e.g. top to bottom). Proportions can be interpreted as an aggregate representation of geomorphic membership. Most soil series (SSURGO components) are associated with a hillslope position and one or more landform-specific positions: hills, mountain slopes, terraces, and/or flats. The values printed to the left (number of component records) and right (Shannon entropy) of stacked bars can be used to judge the reliability of trends. Shannon entropy values close to 0 represent soil series with relatively consistent geomorphic association, while values close to 1 suggest lack thereof. Source: SSURGO component records .

Click the image to view it full size.

Click the image to view it full size.

There are insufficient data to create the 3D mountains figure.

Click the image to view it full size.

Click the image to view it full size.

Soil series sharing subgroup-level classification with BOLAN, arranged according to family differentiae. Hovering over a series name will print full classification and a small sketch from the OSD. Source: snapshot of SC database .

Block Diagrams

Click a link below to display the diagram. Note that these diagrams may be from multiple survey areas.

  1. IA-2011-05-31-27 | Floyd County - 1995

    Pattern of soils and parent material in the Maxfield-Klinger-Dinsdale association (Soil Survey of Floyd County, Iowa; 1995).

Map Units

Map units containing BOLAN as a major component. Limited to 250 records.

Map Unit Name Symbol Map Unit Area (ac) Map Unit Key National Map Unit Symbol Soil Survey Area Publication Date Map Scale
Bolan loam, 2 to 5 percent slopes174B3246403363fjqqia02319781:15840
Bolan loam, 0 to 2 percent slopes174650403362fjqpia02319781:15840
Bolan loam, 5 to 9 percent slopes174C618403364fjqria02319781:15840
Bolan loam, 2 to 5 percent slopes174B2483403789fk5gia03319781:15840
Bolan loam, 0 to 2 percent slopes174752403788fk5fia03319781:15840
Bolan loam, 2 to 5 percent slopes174B2380405008flfsia05519841:15840
Bolan loam, 5 to 9 percent slopes174C706405009flftia05519841:15840
Bolan loam, 2 to 5 percent slopes174B460405217flnjia05719801:15840
Bolan loam, 0 to 2 percent slopes174354405216flnhia05719801:15840
Bolan-Augusta Lake complex, 5 to 9 percent slopes, moderately eroded574C211624812212p8xdia05920111:12000
Bolan loam, 2 to 5 percent slopes174B3750405849fm9xia06719891:15840
Bolan loam, 0 to 2 percent slopes1741847405848fm9wia06719891:15840
Bolan loam, 5 to 9 percent slopes174C268405851fm9zia06719891:15840
Bolan loam, 2 to 5 percent slopes174B2459404871fl9cia06919771:15840
Bolan loam, 5 to 9 percent slopes174C969404872fl9dia06919771:15840
Bolan loam, 0 to 2 percent slopes174124747382p258ia06919771:15840
Bolan loam, 2 to 5 percent slopes174B636406280fmrtia07519731:15840
Bolan loam, 0 to 2 percent slopes1741420406531fn0xia08119871:15840
Bolan loam, 2 to 5 percent slopes174B1096406532fn0yia08119871:15840
Bolan loam, 5 to 9 percent slopes474C381407166fnpdia09319891:15840
Bolan loam, 9 to 14 percent slopes, moderately eroded474D2306407169fnphia09319891:15840
Bolan loam, 0 to 2 percent slopes174397407619fp50ia09919751:15840
Bolan loam, 2 to 5 percent slopes174B698407973fpjfia10319791:15840
Bolan loam, loamy substratum, 2 to 5 percent slopes974B504408069fpmjia10319791:15840
Bolan loam, 2 to 5 percent slopes174B2461408116fpp1ia10519881:15840
Bolan loam, 5 to 9 percent slopes174C611408117fpp2ia10519881:15840
Bolan loam, 2 to 5 percent slopes174B23312606431fpp1ia11319701:15840
Bolan loam, 0 to 2 percent slopes17438926064302qcs2ia11319701:15840
Bolan loam, 5 to 9 percent slopes174C1792606432fpp2ia11319701:15840
Bolan loam, 0 to 2 percent slopes1742264408741fqb6ia11519841:15840
Bolan loam, 2 to 5 percent slopes174B385408742fqb7ia11519841:15840
Bolan loam, 2 to 5 percent slopes174B2372409078fqp2ia11919731:15840
Bolan loam, 5 to 9 percent slopes, moderately eroded174C2976409079fqp3ia11919731:15840
Bolan loam, 0 to 2 percent slopes174221409077fqp1ia11919731:15840
Bolan loam, 9 to 14 percent slopes, moderately eroded174D2190409080fqp4ia11919731:15840
Bolan Loam, 2 to 5 percent slopes174B124745772p202ia13119711:15840
Bolan loam, 0 to 2 percent slopes1742977409946frl2ia13919861:15840
Bolan loam, 2 to 5 percent slopes174B1025409947frl3ia13919861:15840
Bolan loam, 5 to 14 percent slopes474C271410079frqcia14119771:15840
Bolan loam, 2 to 5 percent slopes474B223410078frqbia14119771:15840
Bolan loam, 5 to 9 percent slopes, moderately eroded174C2508410770fsfnia16119751:15840
Bolan loam, 9 to 14 percent slopes, moderately eroded174D2465410771fsfpia16119751:15840
Bolan loam, 2 to 5 percent slopes174B186410769fsfmia16119751:15840
Bolan loam, 0 to 2 percent slopes174731410915fslbia16319891:15840
Bolan loam, 2 to 5 percent slopes474B1610411236fsxpia16719871:15840
Bolan loam, 5 to 9 percent slopes, moderately eroded474C21017411238fsxria16719871:15840
Bolan variant loam, 5 to 9 percent slopes, moderately eroded801C2790411257fsycia16719871:15840
Bolan loam, 2 to 5 percent slopes, moderately eroded474B2733411237fsxqia16719871:15840
Bolan variant loam, 9 to 14 percent slopes, moderately eroded801D2648411258fsydia16719871:15840
Bolan loam, 0 to 2 percent slopes474446411235fsxnia16719871:15840
Bolan loam, 9 to 14 percent slopes, moderately eroded474D2421411239fsxsia16719871:15840
Bolan variant loam, 2 to 5 percent slopes, moderately eroded801B2208411256fsybia16719871:15840
Bolan variant loam, 14 to 25 percent slopes, bouldery801F136411259fsyfia16719871:15840
Bolan loam, 5 to 9 percent slopes174C409411408ft37ia17119891:15840
Bolan loam, 2 to 5 percent slopes174B114411407ft36ia17119891:15840
Bolan loam, 2 to 5 percent slopes174B249323986912lj14ia19520121:12000
Bolan loam, 0 to 2 percent slopes17485623986902lj13ia19520121:12000

Map of Series Extent

Approximate geographic distribution of the BOLAN soil series. To learn more about how this distribution was mapped, or to compare this soil series extent to others, use the Series Extent Explorer (SEE) application. Source: generalization of SSURGO geometry .