| Garlic-Blue Lake-Voelker complex, 8 to 35 percent slopes, dissected | 76E | 5500 | 1455299 | 1kvc4 | mi003 | 2007 | 1:24000 |
Kalkaska-Blue Lake complex, 8 to 35 percent slopes, dissected | 254E | 4143 | 1455403 | 1kvgh | mi003 | 2007 | 1:24000 |
Kalkaska-Blue Lake complex, 6 to 15 percent slopes | 214D | 3358 | 1455361 | 1kvf4 | mi003 | 2007 | 1:24000 |
Steuben-Blue Lake-Kalkaska complex, 6 to 15 percent slopes | 284D | 2803 | 1455422 | 1kvh3 | mi003 | 2007 | 1:24000 |
Steuben-Blue Lake-Kalkaska complex, 1 to 6 percent slopes | 284B | 2525 | 1455421 | 1kvh2 | mi003 | 2007 | 1:24000 |
Garlic-Blue Lake-Voelker complex, 1 to 12 percent slopes, dissected | 76C | 2387 | 1455298 | 1kvc3 | mi003 | 2007 | 1:24000 |
Kalkaska-Blue Lake complex, 15 to 70 percent slopes, dissected | 254F | 2068 | 1455404 | 1kvgj | mi003 | 2007 | 1:24000 |
Kalkaska-Blue Lake complex, 1 to 6 percent slopes | 214B | 1893 | 1455360 | 1kvf3 | mi003 | 2007 | 1:24000 |
Kalkaska-Blue Lake complex, 15 to 35 percent slopes | 214E | 1464 | 1455362 | 1kvf5 | mi003 | 2007 | 1:24000 |
Garlic-Blue Lake-Voelker complex, 6 to 15 percent slopes | 77D | 1027 | 1455302 | 1kvc7 | mi003 | 2007 | 1:24000 |
Kalkaska-Blue Lake complex, 1 to 12 percent slopes, dissected | 254C | 776 | 1455402 | 1kvgg | mi003 | 2007 | 1:24000 |
Garlic-Blue Lake-Voelker complex, 15 to 60 percent slopes, dissected | 76F | 744 | 1455300 | 1kvc5 | mi003 | 2007 | 1:24000 |
Garlic-Blue Lake-Voelker complex, 1 to 6 percent slopes | 77B | 660 | 1455301 | 1kvc6 | mi003 | 2007 | 1:24000 |
Steuben-Blue Lake-Kalkaska complex, 15 to 35 percent slopes | 284E | 570 | 1455423 | 1kvh4 | mi003 | 2007 | 1:24000 |
Garlic-Blue Lake-Voelker complex, 15 to 35 percent slopes | 77E | 191 | 1455303 | 1kvc8 | mi003 | 2007 | 1:24000 |
Blue Lake loamy sand, 0 to 6 percent slopes, deep water table, burned | 315B | 164 | 1455462 | 1kvjd | mi003 | 2007 | 1:24000 |
Blue Lake loamy sand, 0 to 6 percent slopes, burned | 316B | 162 | 1455463 | 1kvjf | mi003 | 2007 | 1:24000 |
Blue Lake loamy sand, 0 to 6 percent slopes, very deep water table, burned | 314B | 48 | 1455461 | 1kvjc | mi003 | 2007 | 1:24000 |
Blue Lake loamy sand, 6 to 15 percent slopes, burned | 316D | 14 | 1455464 | 1kvjg | mi003 | 2007 | 1:24000 |
Morganlake-Ossineke, sandy substratum-Blue Lake complex, 0 to 6 percent slopes | 424B | 47 | 191378 | 6f4h | mi007 | 1998 | 1:12000 |
Blue Lake sand, 18 to 35 percent slopes | 350E | 5 | 191373 | 6f4b | mi007 | 1998 | 1:12000 |
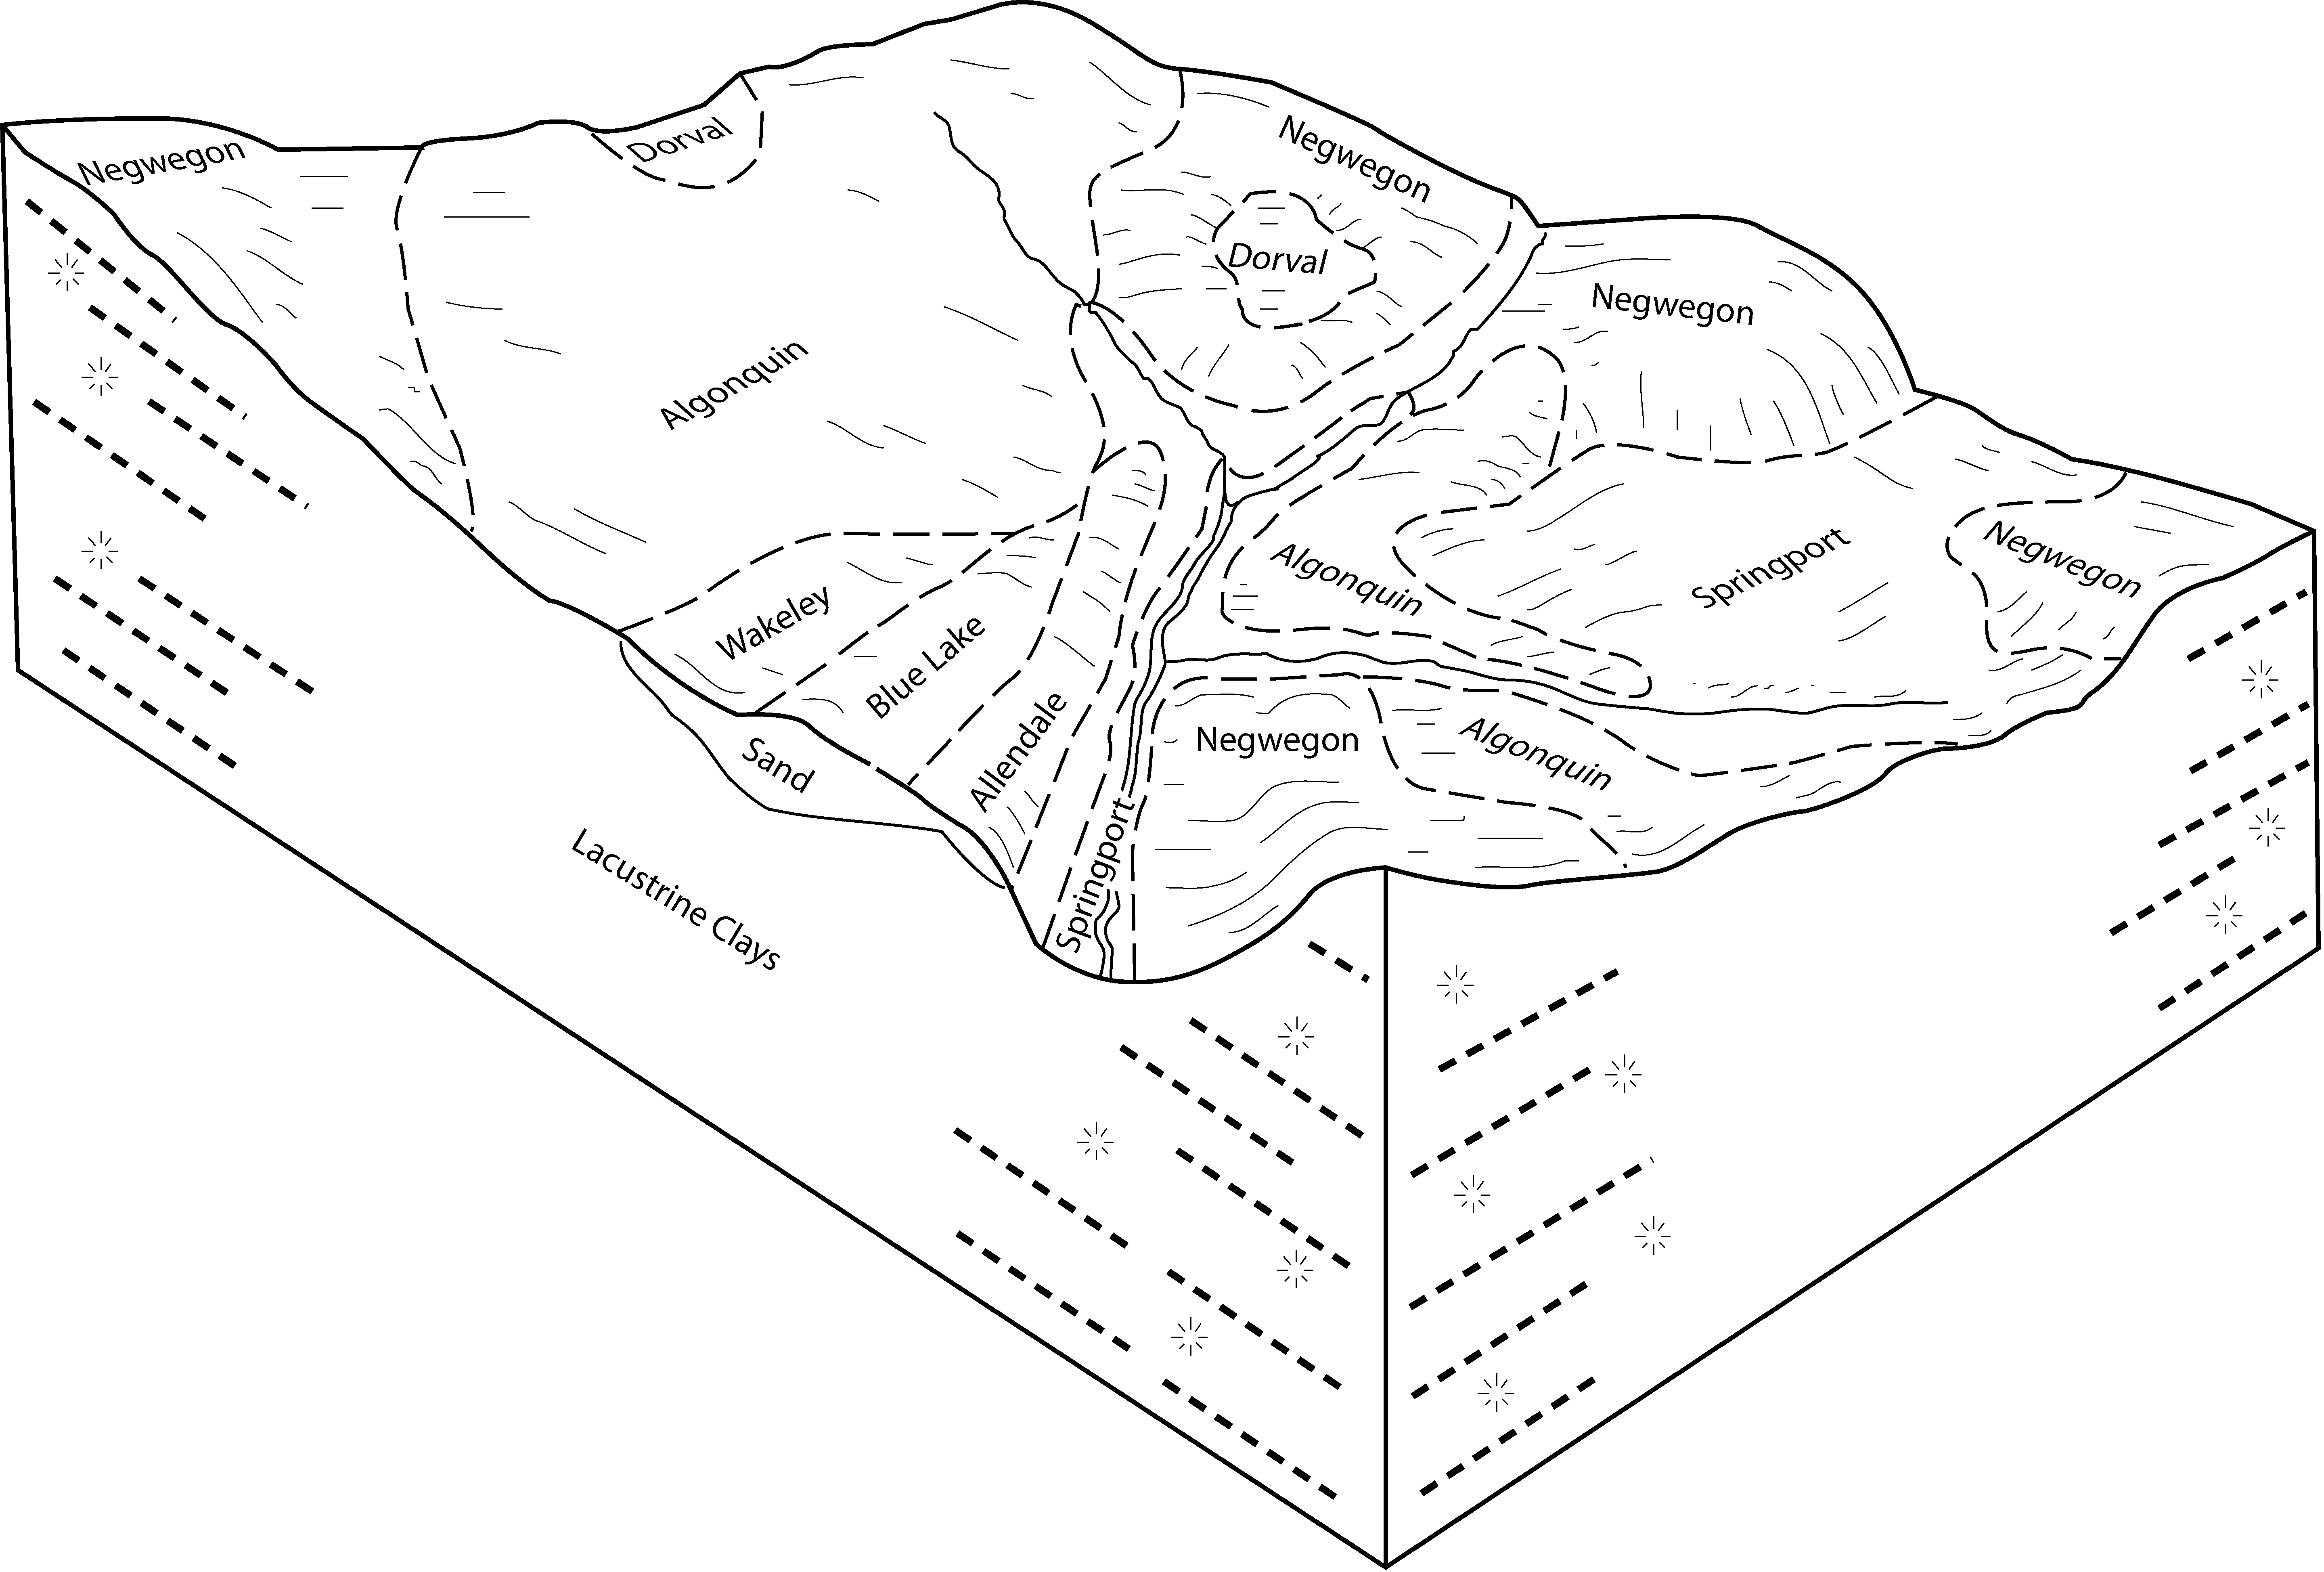
Allendale-Dorval-Blue Lake complex, 0 to 6 percent slopes | 361B | 5 | 191375 | 6f4d | mi007 | 1998 | 1:12000 |
Morganlake-Ossineke, sandy substratum-Blue Lake complex, 6 to 12 percent slopes | 424C | 4 | 191379 | 6f4j | mi007 | 1998 | 1:12000 |
Kalkaska-Blue Lake sands, 18 to 35 percent slopes | KlkbaE | 37227 | 3155929 | 2ytjn | mi009 | 1976 | 1:15840 |
Kalkaska-Blue Lake sands, 6 to 18 percent slopes | KlkbaD | 29274 | 3155887 | 2ytjm | mi009 | 1976 | 1:15840 |
Kalkaska-Blue Lake sands, 0 to 6 percent slopes | KlkbaB | 25329 | 3155927 | 2ytjl | mi009 | 1976 | 1:15840 |
Emmet-Blue Lake loamy sands, 18 to 35 percent slopes | EmtblE | 12674 | 3155904 | 2ytjs | mi009 | 1976 | 1:15840 |
Emmet-Blue Lake loamy sands, 2 to 6 percent slopes | EmtblB | 11135 | 3155901 | 2ytjp | mi009 | 1976 | 1:15840 |
Emmet-Blue Lake loamy sands, 6 to 12 percent slopes | EmtblC | 6800 | 3155902 | 2ytjq | mi009 | 1976 | 1:15840 |
Emmet-Blue Lake loamy sands, lake moderated, 18 to 35 percent slopes | EmtlmE | 6366 | 3155908 | 2ytk7 | mi009 | 1976 | 1:15840 |
Emmet-Blue Lake loamy sands, 12 to 18 percent slopes | EmtblD | 5047 | 3155903 | 2ytjr | mi009 | 1976 | 1:15840 |
Emmet-Blue Lake loamy sands, lake moderated, 12 to 18 percent slopes | EmtlmD | 3261 | 3155907 | 2ytk6 | mi009 | 1976 | 1:15840 |
Emmet-Blue Lake loamy sands, lake moderated, 2 to 6 percent slopes | EmtlmB | 3232 | 3155905 | 2ytk4 | mi009 | 1976 | 1:15840 |
Emmet-Blue Lake loamy sands, lake moderated, 6 to 12 percent slopes | EmtlmC | 3218 | 3155906 | 2ytk5 | mi009 | 1976 | 1:15840 |
Blue Lake loamy sand, 0 to 6 percent slopes | BluaaB | 918 | 3155886 | 2yths | mi009 | 1976 | 1:15840 |
Blue Lake-Kalkaska association, undulating | BKB | 1473 | 190404 | 6d42 | mi029 | 1970 | 1:15840 |
Blue Lake loamy sand, 0 to 6 percent slopes | BlB | 1125 | 190406 | 6d44 | mi029 | 1970 | 1:15840 |
Emmet-Blue Lake loamy sands, 18 to 35 percent slopes | EmtblE | 671 | 3156019 | 2ytjs | mi029 | 1970 | 1:15840 |
Blue Lake-Kalkaska association, rolling | BKC | 630 | 190405 | 6d43 | mi029 | 1970 | 1:15840 |
Blue Lake loamy sand, 6 to 12 percent slopes | BlC | 466 | 190407 | 6d45 | mi029 | 1970 | 1:15840 |
Blue Lake loamy sand, 18 to 50 percent slopes | BlF | 409 | 190409 | 6d47 | mi029 | 1970 | 1:15840 |
Blue Lake loamy sand, 12 to 18 percent slopes | BlD | 221 | 190408 | 6d46 | mi029 | 1970 | 1:15840 |
Emmet-Blue Lake loamy sands, 2 to 6 percent slopes | EmtblB | 202 | 3156016 | 2ytjp | mi029 | 1970 | 1:15840 |
Emmet-Blue Lake loamy sands, 6 to 12 percent slopes | EmtblC | 202 | 3156017 | 2ytjq | mi029 | 1970 | 1:15840 |
Emmet-Blue Lake loamy sands, lake moderated, 18 to 35 percent slopes | EmtlmE | 179 | 3156024 | 2ytk7 | mi029 | 1970 | 1:15840 |
Kalkaska-Blue Lake sands, 18 to 35 percent slopes | KlkbaE | 156 | 3187031 | 2ytjn | mi029 | 1970 | 1:15840 |
Emmet-Blue Lake loamy sands, lake moderated, 6 to 12 percent slopes | EmtlmC | 97 | 3156022 | 2ytk5 | mi029 | 1970 | 1:15840 |
Emmet-Blue Lake loamy sands, 12 to 18 percent slopes | EmtblD | 94 | 3156018 | 2ytjr | mi029 | 1970 | 1:15840 |
Emmet-Blue Lake loamy sands, lake moderated, 12 to 18 percent slopes | EmtlmD | 83 | 3156023 | 2ytk6 | mi029 | 1970 | 1:15840 |
Kalkaska-Blue Lake sands, 0 to 6 percent slopes | KlkbaB | 71 | 3156029 | 2ytjl | mi029 | 1970 | 1:15840 |
Emmet-Blue Lake loamy sands, lake moderated, 2 to 6 percent slopes | EmtlmB | 69 | 3156020 | 2ytk4 | mi029 | 1970 | 1:15840 |
Kalkaska-Blue Lake sands, 6 to 18 percent slopes | KlkbaD | 45 | 3156021 | 2ytjm | mi029 | 1970 | 1:15840 |
Blue Lake loamy sand, 0 to 6 percent slopes | 18B | 14561 | 190539 | 6d8f | mi031 | 1988 | 1:15840 |
Blue Lake loamy sand, 6 to 12 percent slopes | 18C | 9018 | 190540 | 6d8g | mi031 | 1988 | 1:15840 |
Blue Lake loamy sand, 12 to 30 percent slopes | 18D | 8670 | 190541 | 6d8h | mi031 | 1988 | 1:15840 |
Blue Lake loamy sand, 30 to 50 percent slopes | 18F | 2116 | 190542 | 6d8j | mi031 | 1988 | 1:15840 |
Blue Lake loamy sand, 0 to 6 percent slopes | 52B | 6845 | 189724 | 6cf4 | mi039 | 1993 | 1:15840 |
Blue Lake loamy sand, 6 to 18 percent slopes | 52D | 405 | 189725 | 6cf5 | mi039 | 1993 | 1:15840 |
Blue Lake sand, 0 to 6 percent slopes | BlB | 1361 | 1588017 | 1q9gc | mi041 | 1969 | 1:24000 |
Blue Lake sand, 6 to 18 percent slopes | BlD | 255 | 1588018 | 1q9gd | mi041 | 1969 | 1:24000 |
Blue Lake sand, 18 to 40 percent slopes | BlE | 20 | 1588019 | 1q9gf | mi041 | 1969 | 1:24000 |
Blue Lake loamy sand, 0 to 6 percent slopes | BlB | 31080 | 189309 | 6bzr | mi047 | 1968 | 1:20000 |
Blue Lake loamy sand, 6 to 12 percent slopes | BlC | 22360 | 189310 | 6bzs | mi047 | 1968 | 1:20000 |
Blue Lake loamy sand, 25 to 60 percent slopes | BlF | 17128 | 189313 | 6bzw | mi047 | 1968 | 1:20000 |
Blue Lake loamy sand, 18 to 25 percent slopes | BlE | 16679 | 189312 | 6bzv | mi047 | 1968 | 1:20000 |
Blue Lake loamy sand, 12 to 18 percent slopes | BlD | 5839 | 189311 | 6bzt | mi047 | 1968 | 1:20000 |
Kalkaska-Blue Lake loamy sands, 0 to 6 percent slopes | KbB | 1245 | 189348 | 6c10 | mi047 | 1968 | 1:20000 |
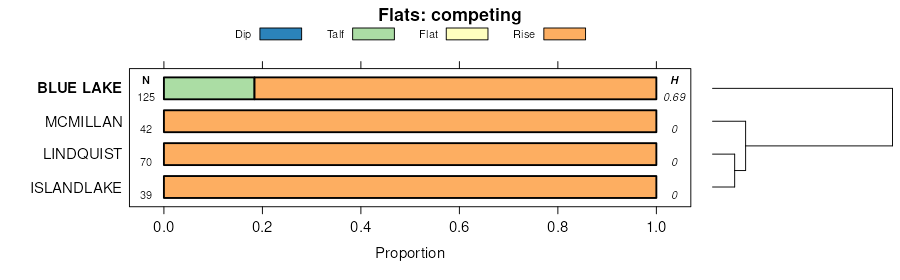
Islandlake-Blue Lake complex, 0 to 6 percent slopes | 366B | 10031 | 190649 | 6dcz | mi079 | 1998 | 1:12000 |
Islandlake-Blue Lake complex, 6 to 12 percent slopes | 366C | 5055 | 190650 | 6dd0 | mi079 | 1998 | 1:12000 |
Islandlake-Blue Lake complex, 12 to 18 percent slopes | 366D | 3328 | 190693 | 6dfd | mi079 | 1998 | 1:12000 |
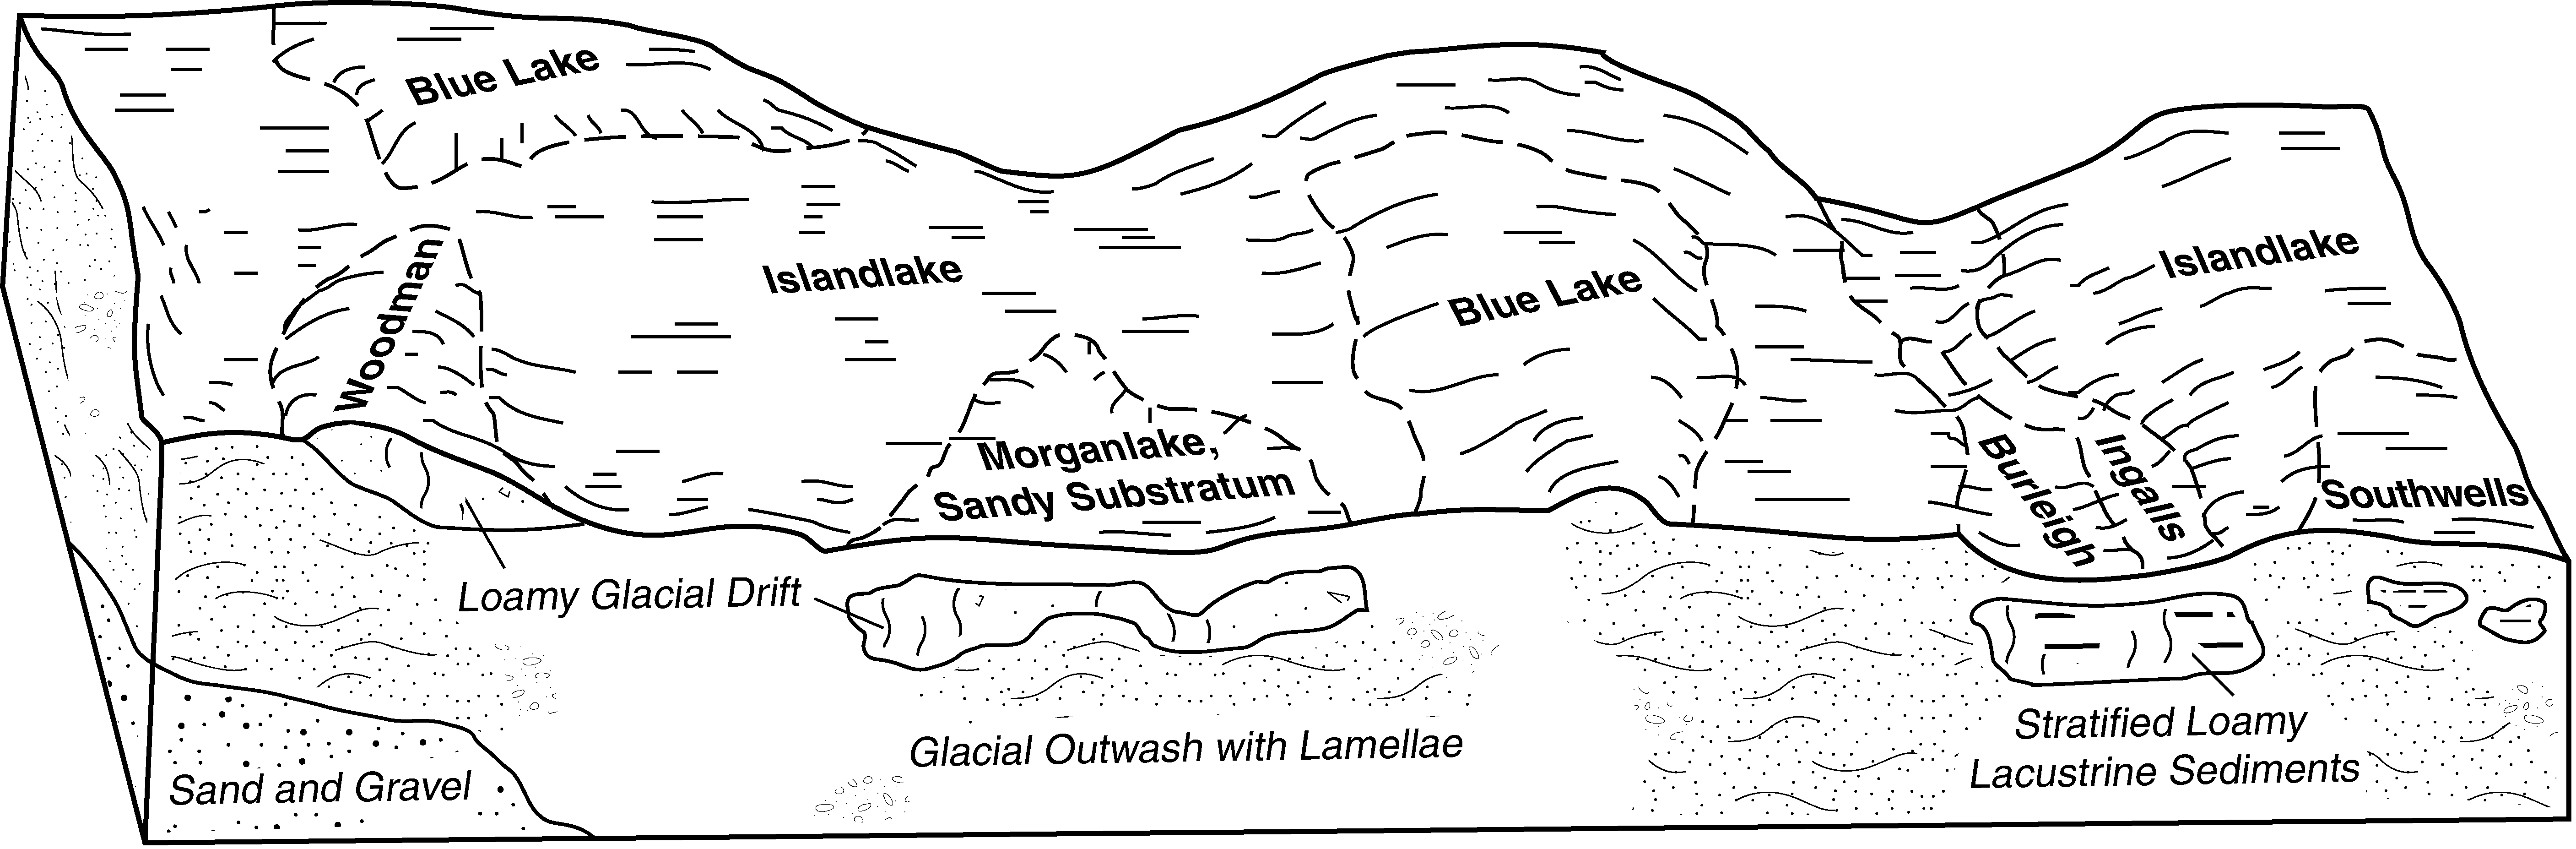
Morganlake, sandy substratum-Woodman-Blue Lake complex, 1 to 6 percent slopes | 467B | 2571 | 190723 | 6dgc | mi079 | 1998 | 1:12000 |
Islandlake-Blue Lake complex, 18 to 35 percent slopes | 366E | 1618 | 190694 | 6dff | mi079 | 1998 | 1:12000 |
Morganlake, sandy substratum-Woodman-Blue Lake complex, 6 to 12 percent slopes | 467C | 1158 | 190724 | 6dgd | mi079 | 1998 | 1:12000 |
Kalkaska-Blue Lake sands, 0 to 6 percent slopes | KlkbaB | 1119 | 3187041 | 2ytjl | mi079 | 1998 | 1:12000 |
Kalkaska-Blue Lake sands, 18 to 35 percent slopes | KlkbaE | 407 | 3187042 | 2ytjn | mi079 | 1998 | 1:12000 |
Kalkaska-Blue Lake sands, 6 to 18 percent slopes | KlkbaD | 375 | 3187037 | 2ytjm | mi079 | 1998 | 1:12000 |
Mancelona-Blue Lake complex, 0 to 6 percent slopes | 471B | 282 | 190728 | 6dgj | mi079 | 1998 | 1:12000 |
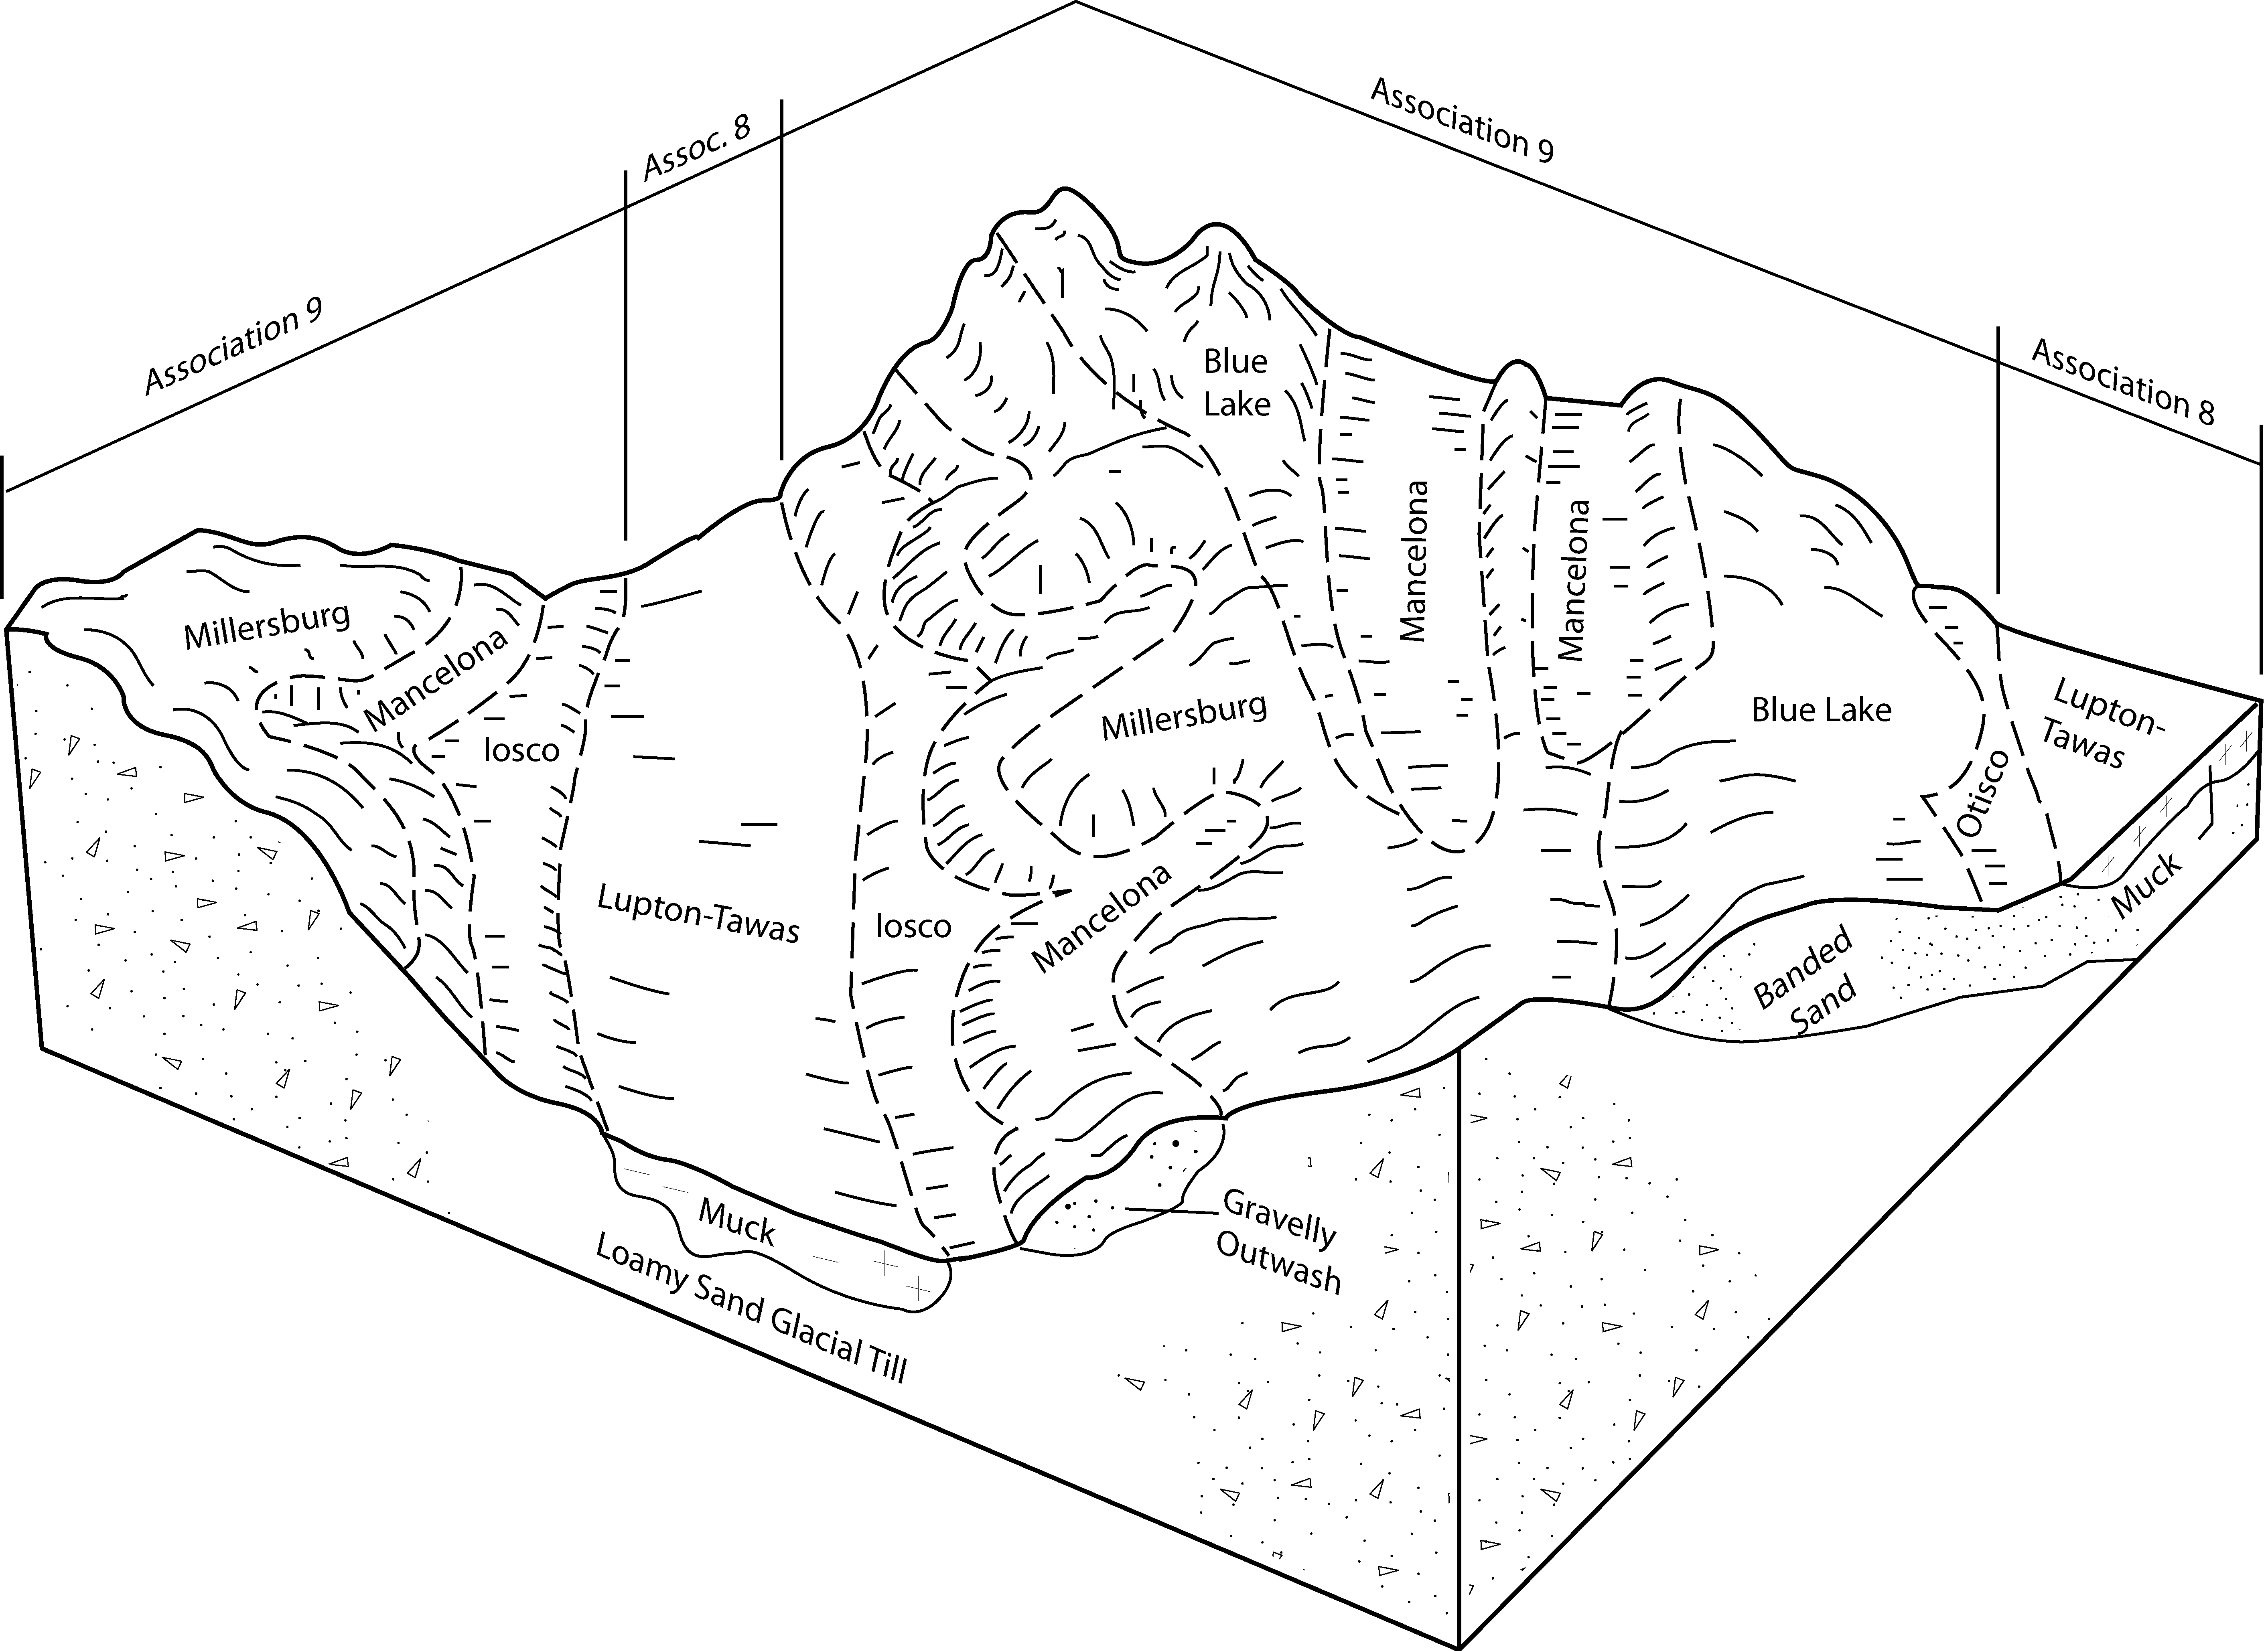
Mancelona-Millersburg-Blue Lake complex, 6 to 18 percent slopes | 363D | 6401 | 192259 | 6g1x | mi119 | 1997 | 1:12000 |
Allendale-Dorval-Blue Lake complex, 0 to 6 percent slopes | 361B | 4218 | 192255 | 6g1s | mi119 | 1997 | 1:12000 |
Morganlake-Ossineke, sandy substratum-Blue Lake complex, 0 to 6 percent slopes | 424B | 4010 | 192400 | 6g6g | mi119 | 1997 | 1:12000 |
Mancelona-Millersburg-Blue Lake complex, 8 to 35 percent slopes, dissected | 364E | 2548 | 192260 | 6g1y | mi119 | 1997 | 1:12000 |
Blue Lake sand, 0 to 6 percent slopes | 350B | 2525 | 192244 | 6g1f | mi119 | 1997 | 1:12000 |
Morganlake-Ossineke, sandy substratum-Blue Lake complex, 6 to 12 percent slopes | 424C | 2283 | 192401 | 6g6h | mi119 | 1997 | 1:12000 |
Blue Lake sand, 6 to 18 percent slopes | 350D | 1771 | 192245 | 6g1g | mi119 | 1997 | 1:12000 |
Menominee-Bamfield, sandy substratum-Blue Lake complex, 12 to 18 percent slopes | 399D | 1510 | 192170 | 6fz1 | mi119 | 1997 | 1:12000 |
Millersburg-Blue Lake complex, 0 to 6 percent slopes | 450B | 1142 | 192301 | 6g38 | mi119 | 1997 | 1:12000 |
Millersburg-Blue Lake complex, 6 to 18 percent slopes | 450D | 1032 | 192302 | 6g39 | mi119 | 1997 | 1:12000 |
Millersburg-Blue Lake complex, 18 to 35 percent slopes | 450E | 727 | 192303 | 6g3b | mi119 | 1997 | 1:12000 |
Mancelona-Ossineke-Blue Lake complex, 0 to 6 percent slopes | 353B | 479 | 192249 | 6g1l | mi119 | 1997 | 1:12000 |
Menominee-Bamfield, sandy substratum-Blue Lake complex, 18 to 70 percent slopes, dissected | 400F | 475 | 192398 | 6g6d | mi119 | 1997 | 1:12000 |
Mancelona-Blue Lake sands, 15 to 70 percent slopes, dissected | 354F | 469 | 192252 | 6g1p | mi119 | 1997 | 1:12000 |
Blue Lake sand, 18 to 35 percent slopes | 350E | 240 | 192246 | 6g1h | mi119 | 1997 | 1:12000 |
Blue Lake loamy sand, 6 to 12 percent slopes | BlC | 2284 | 189988 | 6cpn | mi133 | 1966 | 1:15840 |
Blue Lake loamy sand, 2 to 6 percent slopes | BlB | 1697 | 189987 | 6cpm | mi133 | 1966 | 1:15840 |
Blue Lake loamy sand, 12 to 18 percent slopes | BlD | 1175 | 189989 | 6cpp | mi133 | 1966 | 1:15840 |
Blue Lake loamy sand, 18 to 25 percent slopes | BlE | 463 | 189990 | 6cpq | mi133 | 1966 | 1:15840 |
Blue Lake loamy sand, 0 to 2 percent slopes | BlA | 330 | 189986 | 6cpl | mi133 | 1966 | 1:15840 |
Islandlake-Blue Lake sands, 6 to 18 percent slopes | 508D | 1035 | 628149 | p2mw | mi135 | 2003 | 1:12000 |
Morganlake-Ossineke, sandy substratum-Blue Lake complex, 6 to 12 percent slopes | 424C | 829 | 628170 | p2nk | mi135 | 2003 | 1:12000 |
Islandlake-Blue Lake sands, 0 to 6 percent slopes | 508B | 811 | 628150 | p2mx | mi135 | 2003 | 1:12000 |
Morganlake-Ossineke, sandy substratum-Blue Lake complex, 0 to 6 percent slopes | 424B | 692 | 628171 | p2nl | mi135 | 2003 | 1:12000 |
Menominee-Bamfield, sandy substratum-Blue Lake complex, 12 to 18 percent slopes | 399D | 195 | 628161 | p2n8 | mi135 | 2003 | 1:12000 |
Islandlake-Blue Lake sands, 18 to 35 percent slopes | 508E | 166 | 628148 | p2mv | mi135 | 2003 | 1:12000 |
Menominee-Bamfield, sandy substratum-Blue Lake complex, 18 to 70 percent slopes, dissected | 400F | 128 | 628172 | p2nm | mi135 | 2003 | 1:12000 |
Blue Lake loamy sand, 0 to 6 percent slopes | 52B | 23584 | 191506 | 6f8m | mi137 | 1998 | 1:12000 |
Blue Lake loamy sand, 6 to 18 percent slopes | 52D | 18623 | 191507 | 6f8n | mi137 | 1998 | 1:12000 |
Blue Lake loamy sand, 8 to 50 percent slopes, dissected | 365F | 12855 | 191484 | 6f7x | mi137 | 1998 | 1:12000 |
Menominee-Bamfield, sandy substratum-Blue Lake complex, 18 to 70 percent slopes, dissected | 400F | 2752 | 191493 | 6f86 | mi137 | 1998 | 1:12000 |
Menominee-Bamfield, sandy substratum-Blue Lake complex, 12 to 18 percent slopes | 399D | 2289 | 191492 | 6f85 | mi137 | 1998 | 1:12000 |
Blue Lake loamy sand, 18 to 35 percent slopes | 52E | 2115 | 191508 | 6f8p | mi137 | 1998 | 1:12000 |
Morganlake-Ossineke, sandy substratum-Blue Lake complex, 0 to 6 percent slopes | 424B | 1817 | 191497 | 6f8b | mi137 | 1998 | 1:12000 |
Morganlake-0ssineke, sandy substratum,-Blue Lake complex, 6 to 12 percent slopes | 424C | 1469 | 191498 | 6f8c | mi137 | 1998 | 1:12000 |
Mancelona-Blue Lake sands, 15 to 70 percent slopes, dissected | 354F | 1408 | 191553 | 6fb4 | mi137 | 1998 | 1:12000 |
Kalkaska-Blue Lake sands, 6 to 18 percent slopes | KlkbaD | 126 | 3187047 | 2ytjm | mi137 | 1998 | 1:12000 |
Kalkaska-Blue Lake sands, 18 to 35 percent slopes | KlkbaE | 92 | 3187051 | 2ytjn | mi137 | 1998 | 1:12000 |
Blue Lake sand, 6 to 18 percent slopes | 350D | 26 | 191542 | 6f9s | mi137 | 1998 | 1:12000 |
Kalkaska-Blue Lake sands, 0 to 6 percent slopes | KlkbaB | 10 | 3187050 | 2ytjl | mi137 | 1998 | 1:12000 |